Why Stochastics Matter
Markets often move within ranges before breaking out. Stochastics was built to capture where the latest closing price sits within that range, highlighting when momentum is stretched or shifting.
Clarity: Shows if prices are closing near recent highs or lows.
Flexibility: Useful across timeframes, from intraday charts to weekly and monthly views.
Momentum insight: Identifies potential turning points when momentum no longer confirms price.
How Traders Use Stochastics
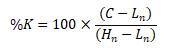
Overbought / Oversold levels: Readings above 80 suggest prices are near the top of their recent range; below 20 suggests they’re near the bottom.
%K / %D crossovers: When %K crosses above %D, momentum is strengthening; when it crosses below, momentum is weakening.
Divergences: Price making new highs while Stochastics fails to do so (or vice versa) may signal momentum exhaustion.
Multiple timeframes: Day traders often use shorter lookbacks for fast signals, while swing traders use daily or weekly settings for steadier confirmation.
Real-World Results: Do They Actually Work?
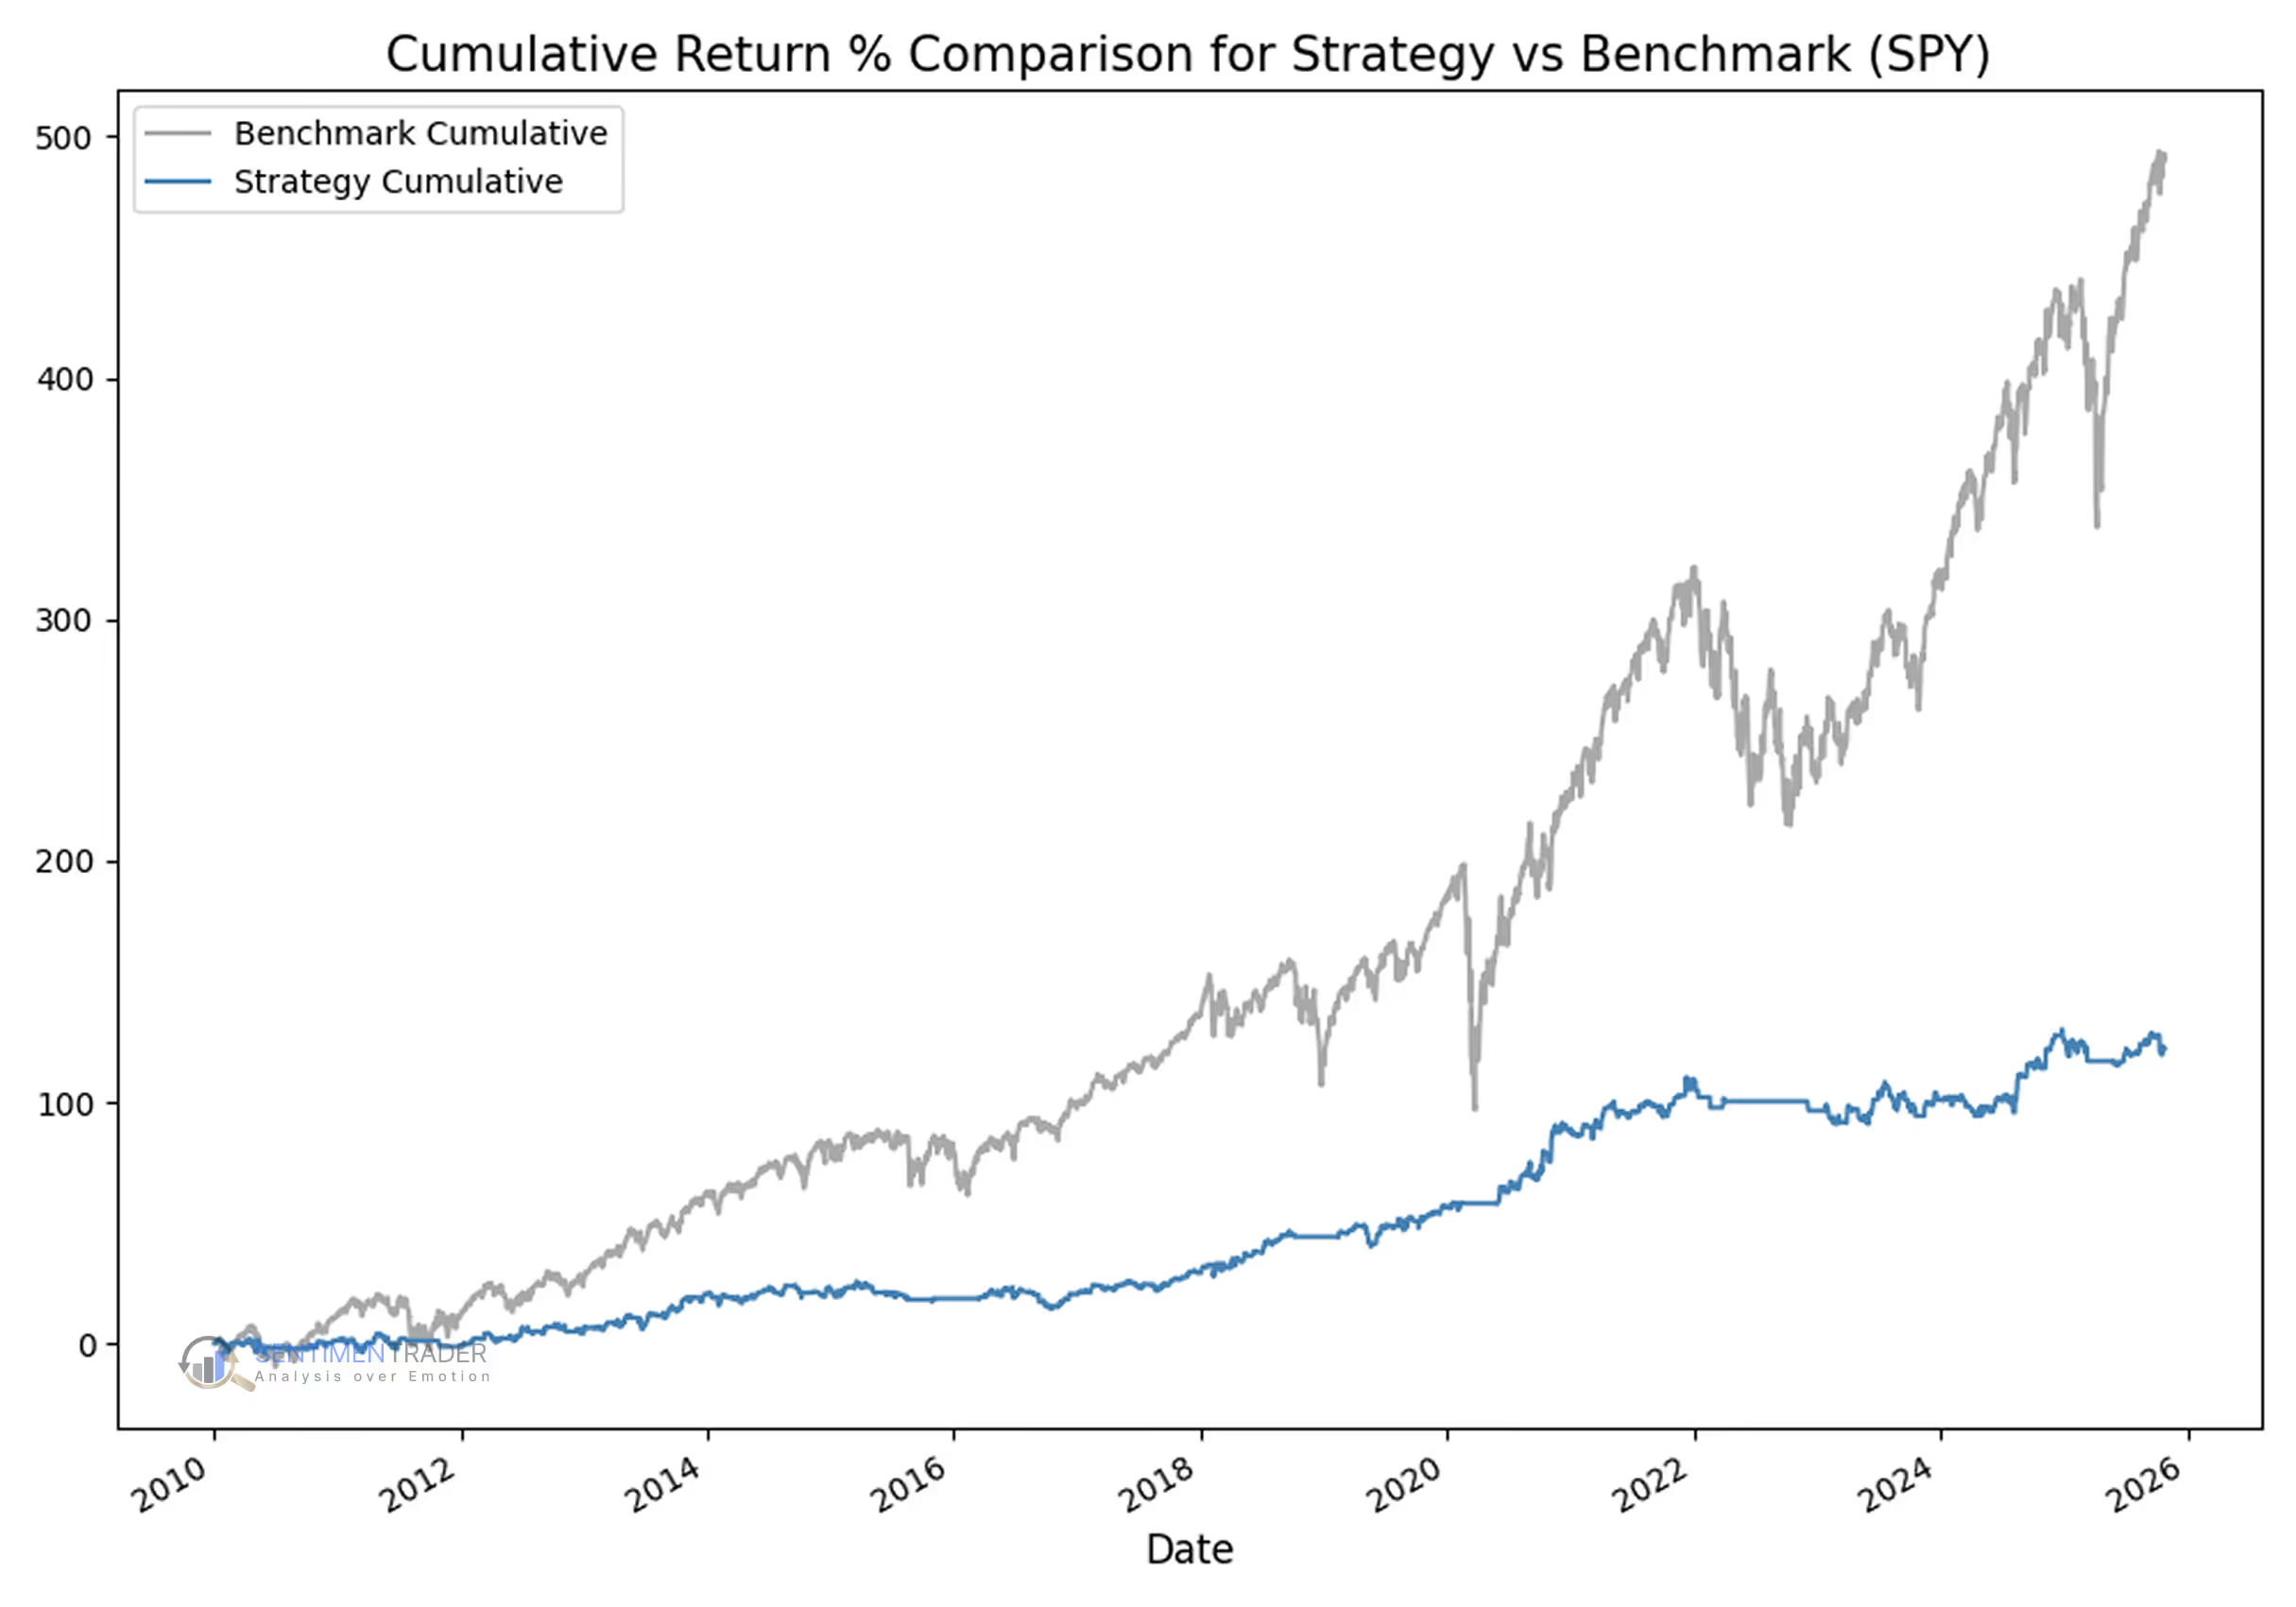
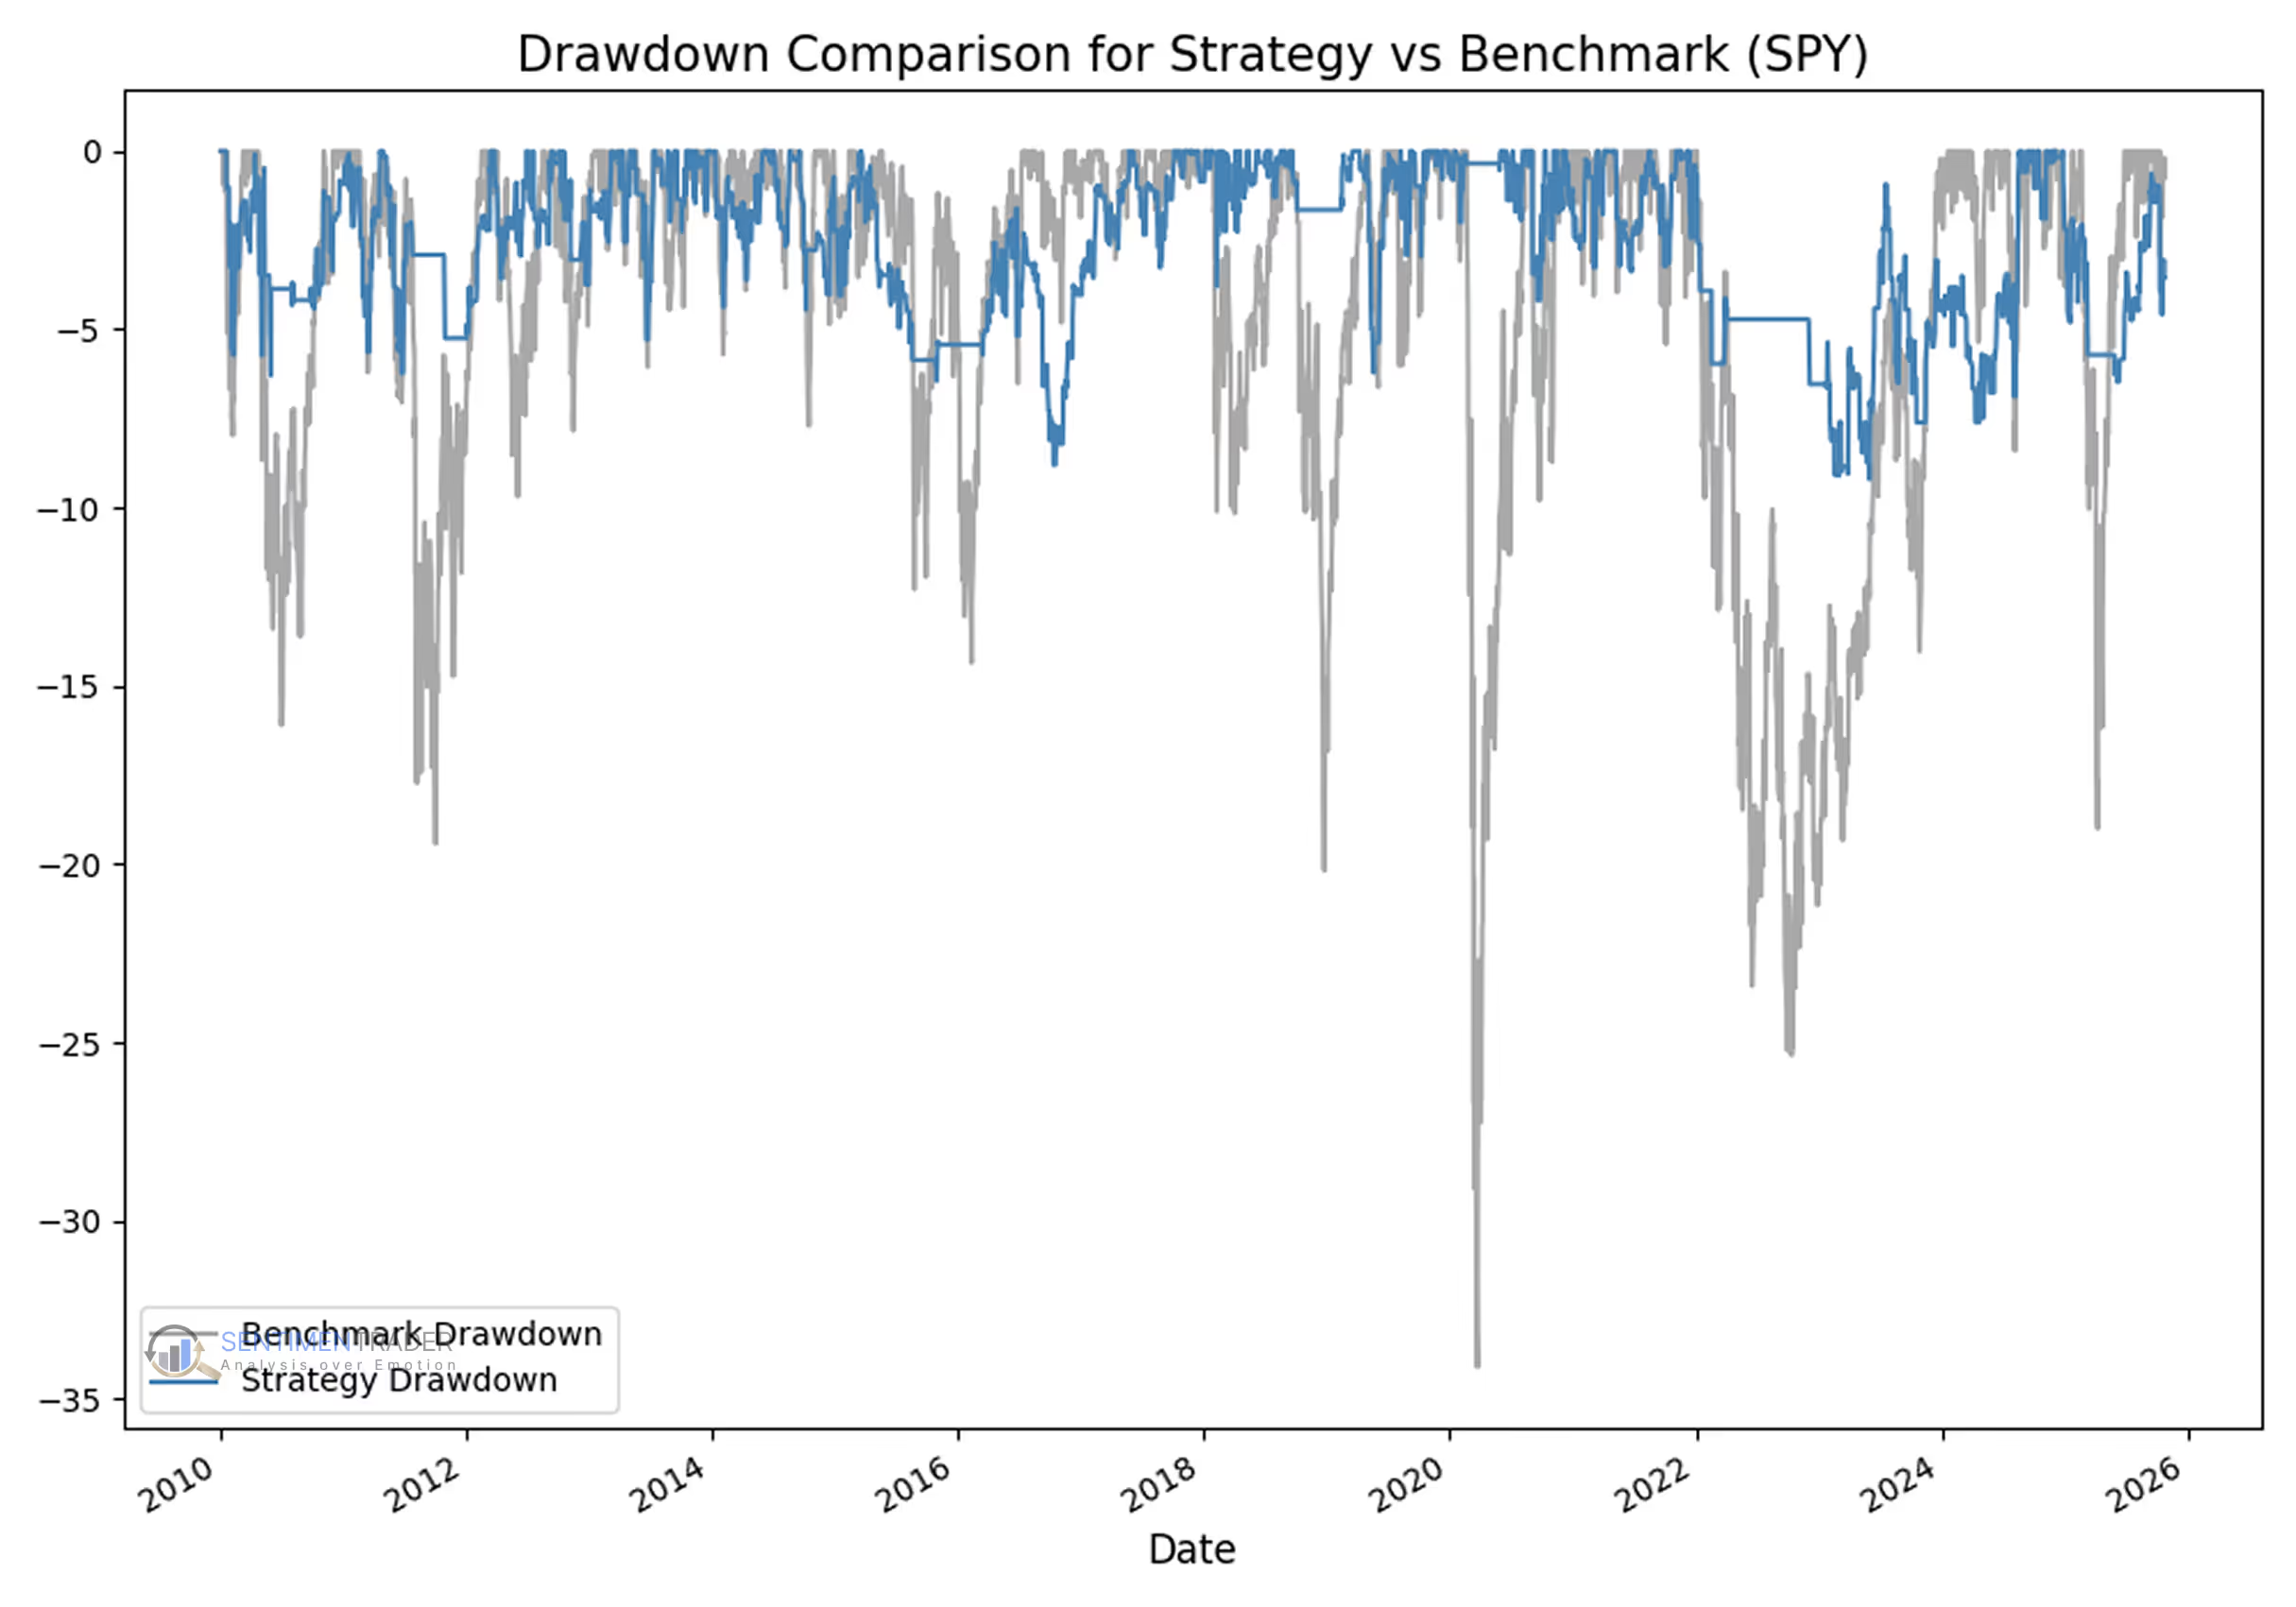
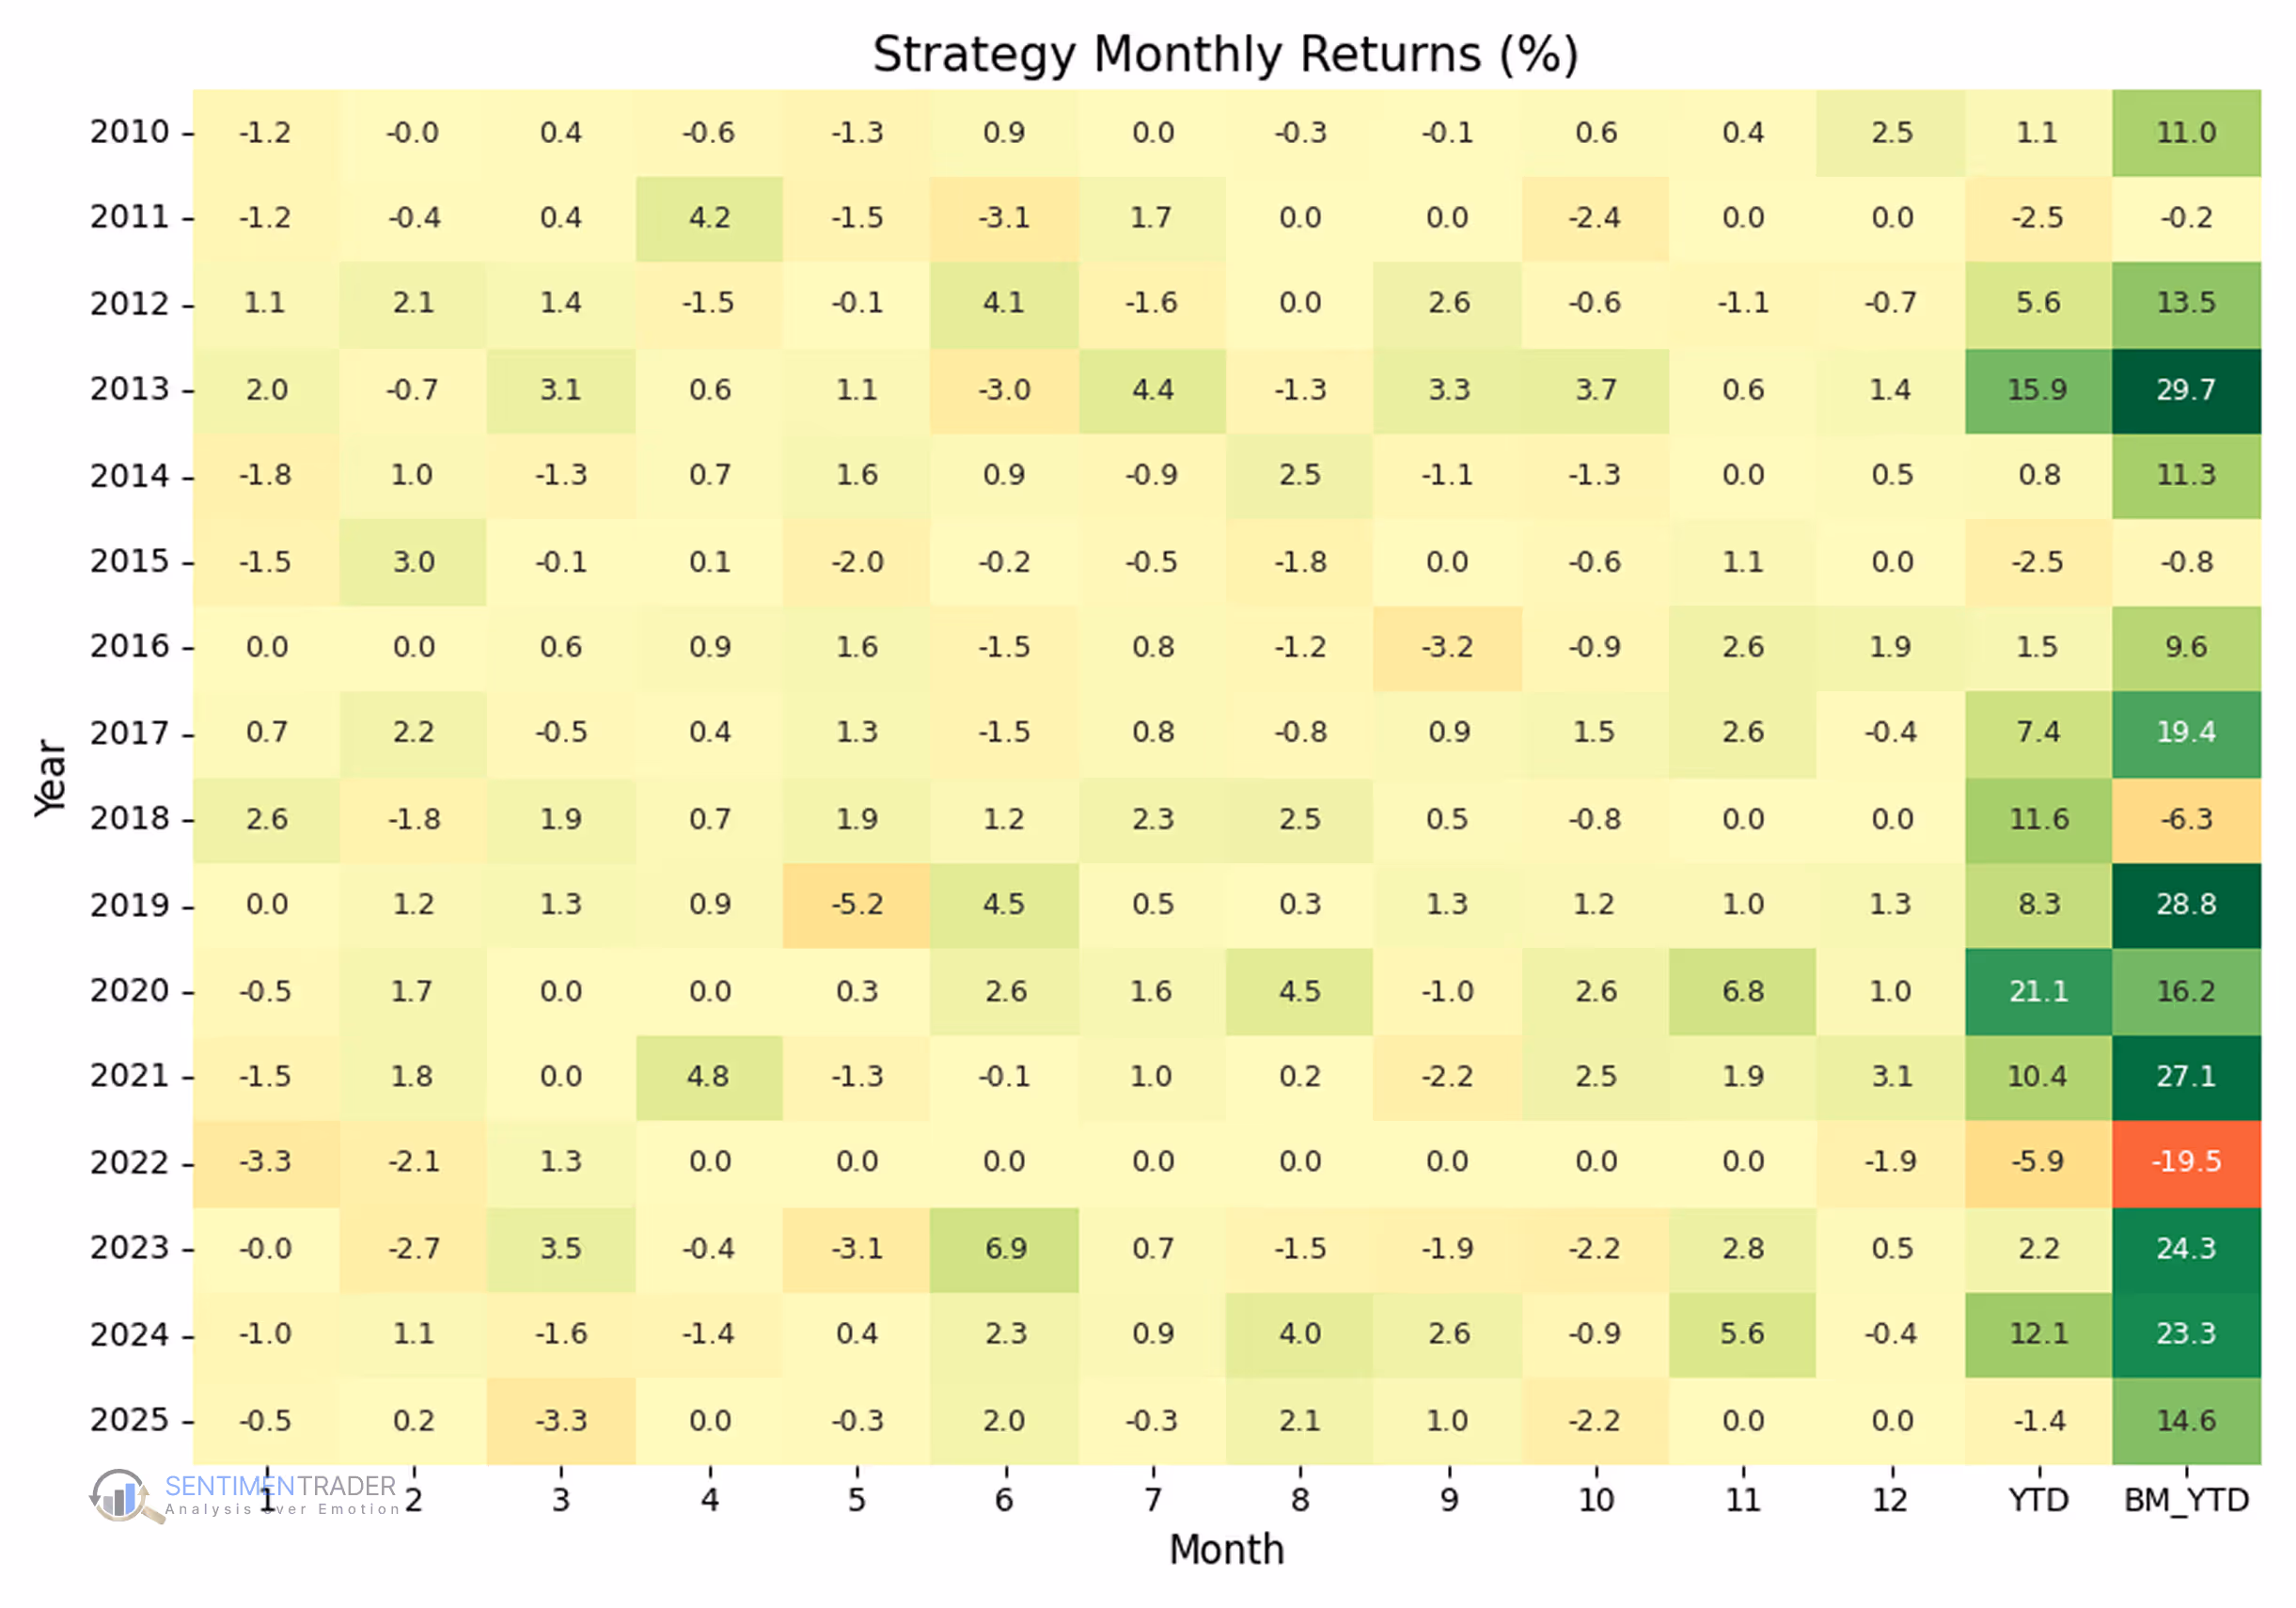
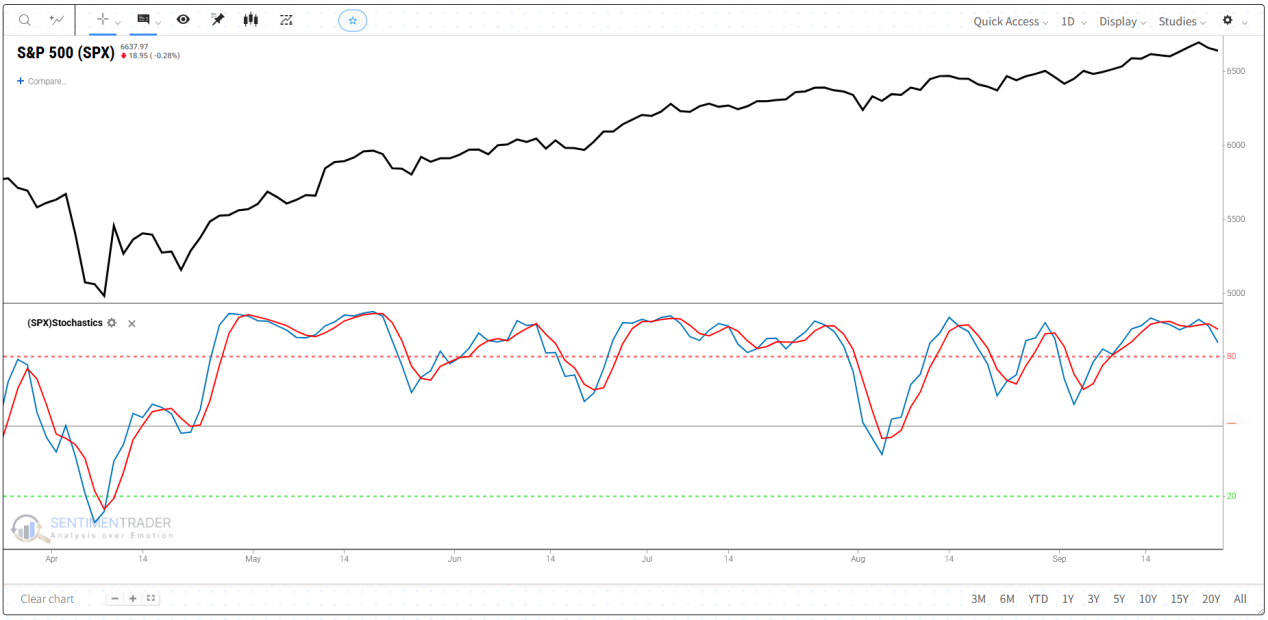
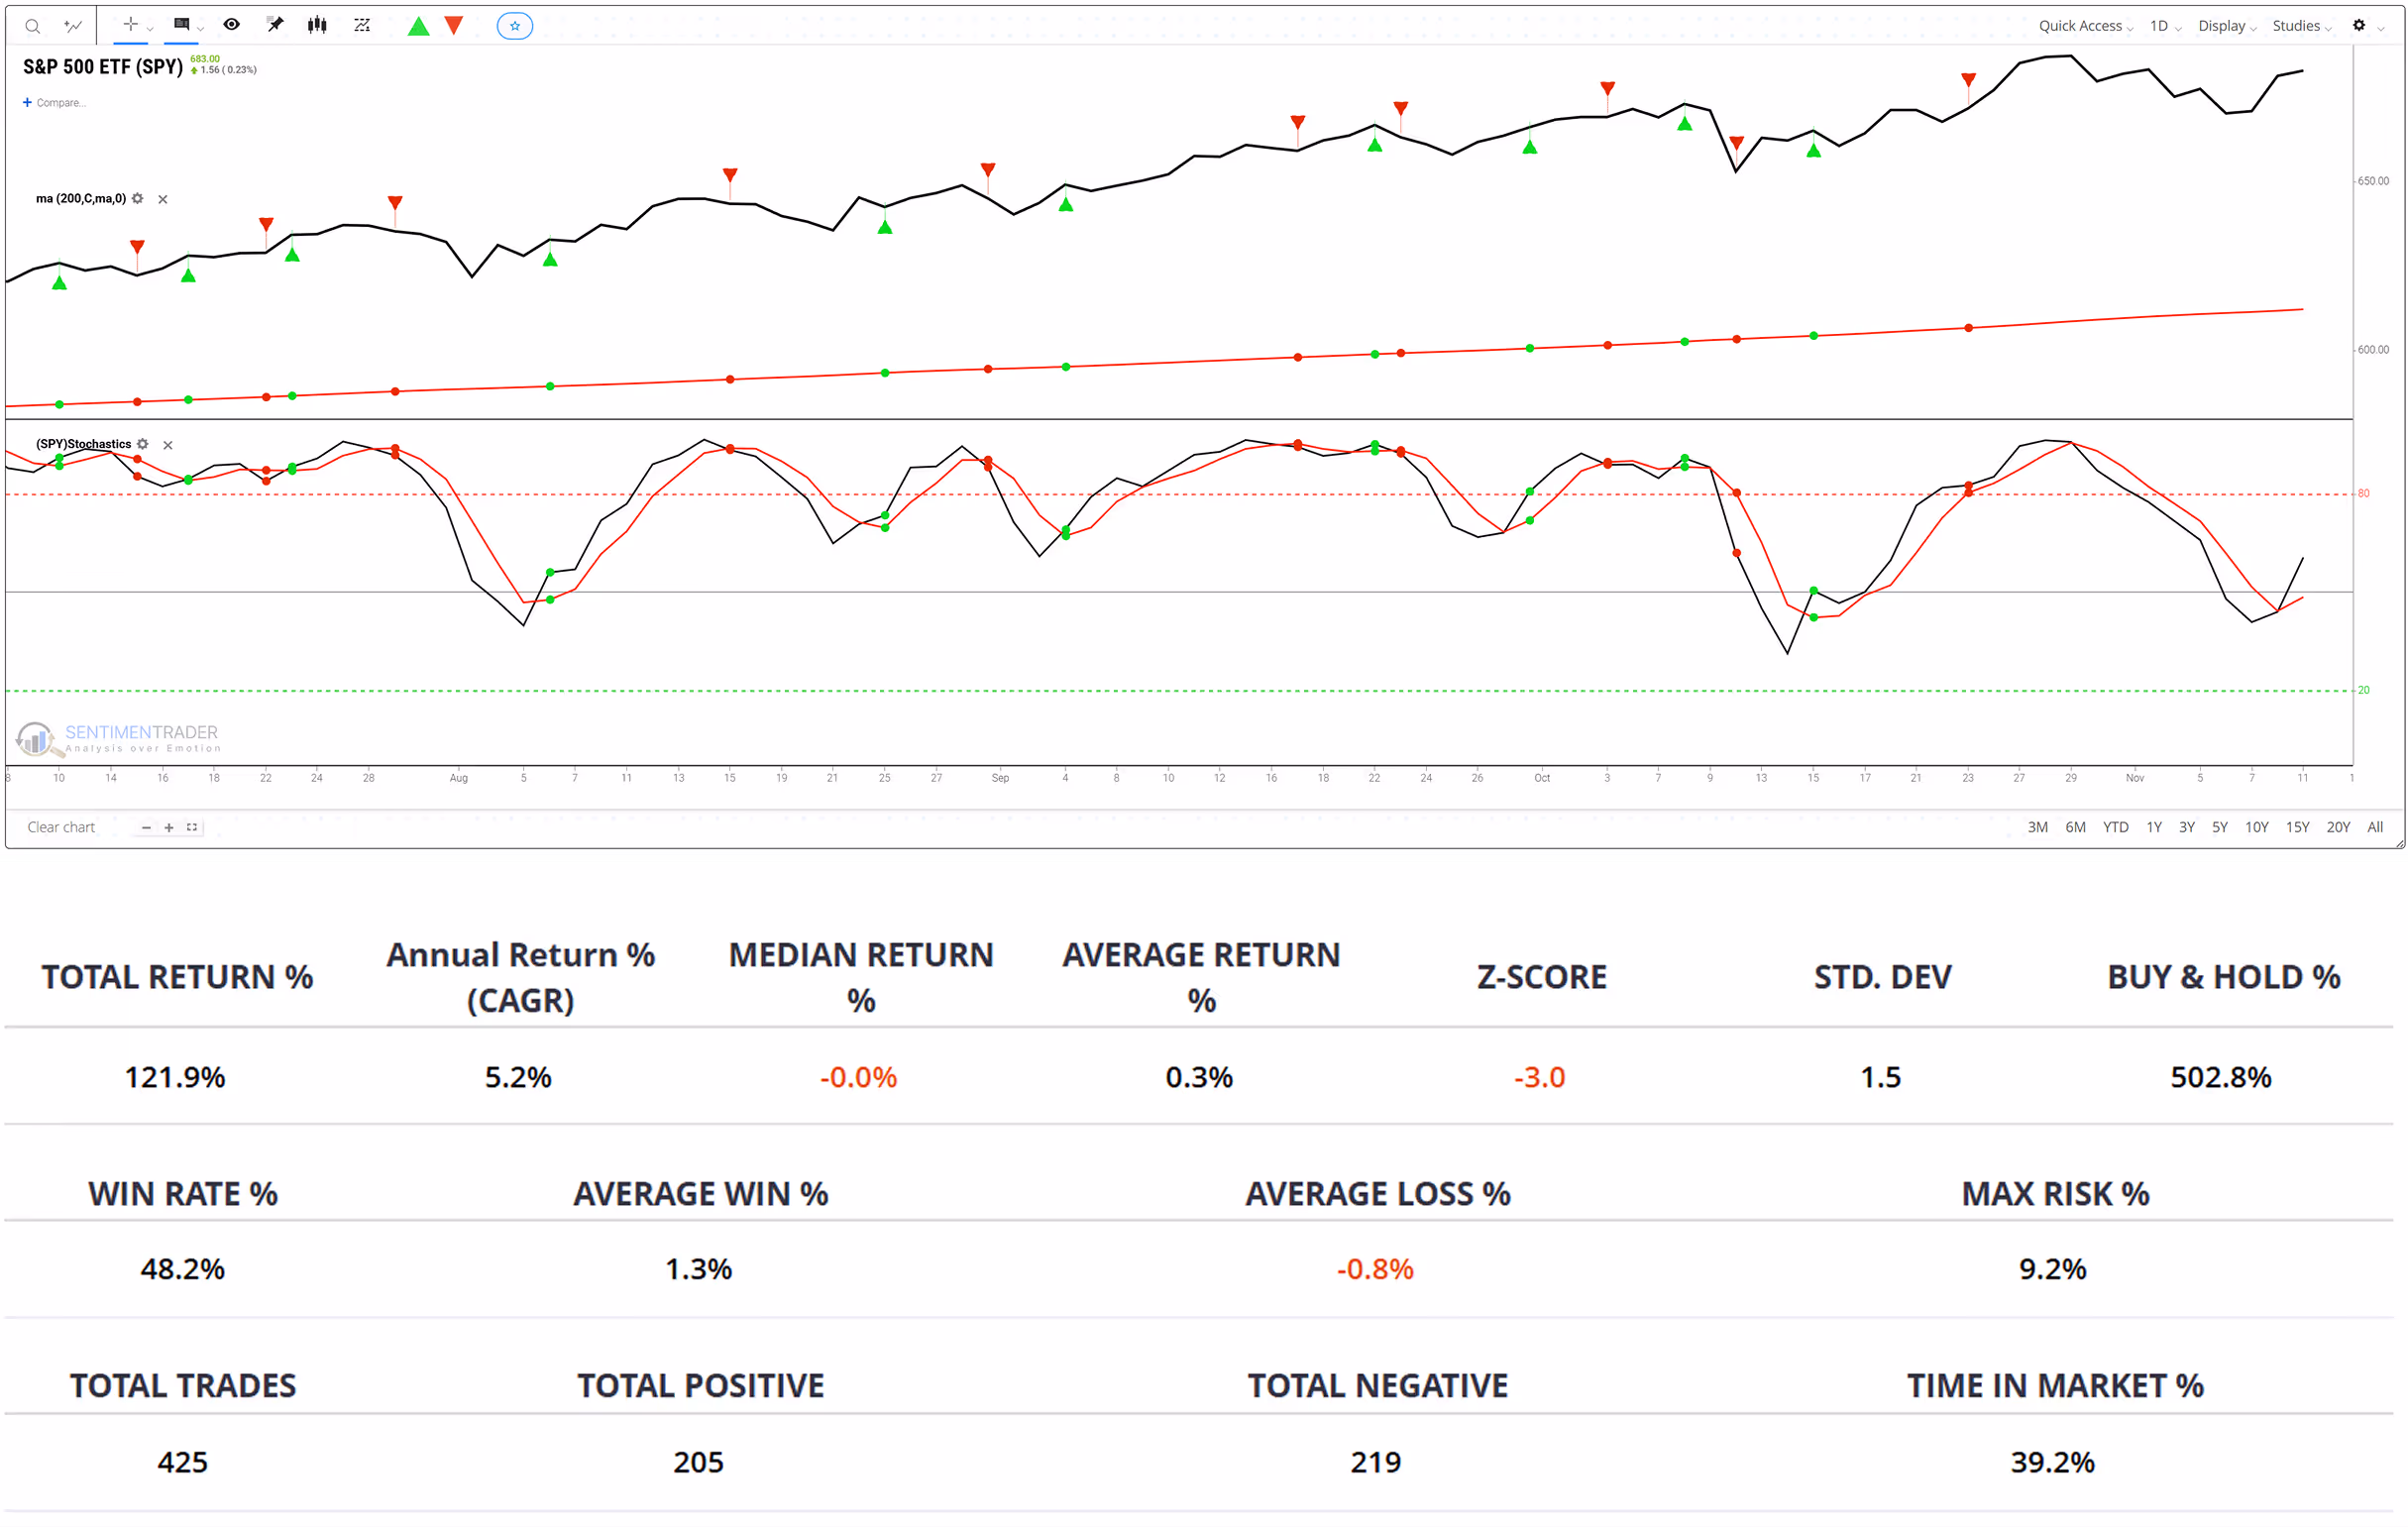
To evaluate how Stochastics performs as a short-term momentum confirmation tool, we ran a backtest on SPY (2010–2025) using a %K CrossAbove %D rule active only when price was above its 200-day MA.
Results over 15 years:
+121.9% total return (vs. +502.8% for buy-and-hold).
Smaller drawdowns: –9.2 % max risk vs. SPY’s –30 % to –35 % in major sell-offs.
Time in market: 39.2 %, limiting exposure during choppy periods.
Takeaway: Even though this %K/%D setup lagged buy-and-hold in total return, it historically provided steadier performance with shallow drawdowns and lower volatility. It worked best as a momentum-reset signal within ongoing uptrends, helping traders re-enter strength after pullbacks rather than chase extremes.
This backtest was run using SentimenTrader's Proprietary Backtest Engine, which lets you test your strategy with nearly 100 technical indicators and over 17,000 indicators covering Sentiment, Trend Score, Breadth, Macro, and Seasonality. No coding required.
The Technical Bit
Calculation and Components
The Stochastic oscillator compares the latest close with the recent high-low range:
Where:
C = most recent closing price
Ln = lowest low over the past n periods (default 14)
Hn = highest high over the past n periods
%K is the raw measure, sometimes called the “fast” stochastic. %D is a 3-period moving average of %K and acts as the smoother signal line.
Quick note on Moving Average: A moving average smooths out fluctuations by averaging values over time. In Stochastics, %D helps filter noise from the more volatile %K line. Settings
Default: 14-period lookback with %D as a 3-period moving average.
Shorter lookbacks (e.g., 5–9 periods): More sensitive, more signals, more noise.
Longer lookbacks (e.g., 21–28 periods): Smoother, fewer signals, slower to react.
Variations: “Slow Stochastic” applies extra smoothing to %K, reducing whipsaws.
What This Means for Traders
Stochastics provides a framework for spotting when momentum looks stretched or is no longer confirming price. This can add discipline when emotions suggest chasing moves.
Still, Stochastics can give false signals, especially in volatile or choppy markets. That’s why traders often combine it with tools from other categories—for example, Moving Averages (Trend) to confirm direction, On-Balance Volume (Volume) to gauge participation, or Bollinger Bands (Volatility) to check if moves are outside typical ranges. Using multiple lenses, and validating ideas with a backtest, helps separate reliable signals from noise.


.avif)