Why the SPY Optix Matters
Investor sentiment around the S&P 500 often shifts faster than fundamentals, especially during volatile market phases. The SPY Optix helps visualize these emotional tides—revealing when enthusiasm or fear becomes statistically excessive before prices react.
Clarity: Simplifies complex market inputs—like options activity and volatility—into one clear sentiment score for the S&P 500 ETF.
Context: Captures how traders collectively perceive short-term risk and opportunity in the broad equity market.
Insight: Identifies emotional extremes that have historically preceded short-term cooling phases or rebounds.
How Traders Use SPY Optix
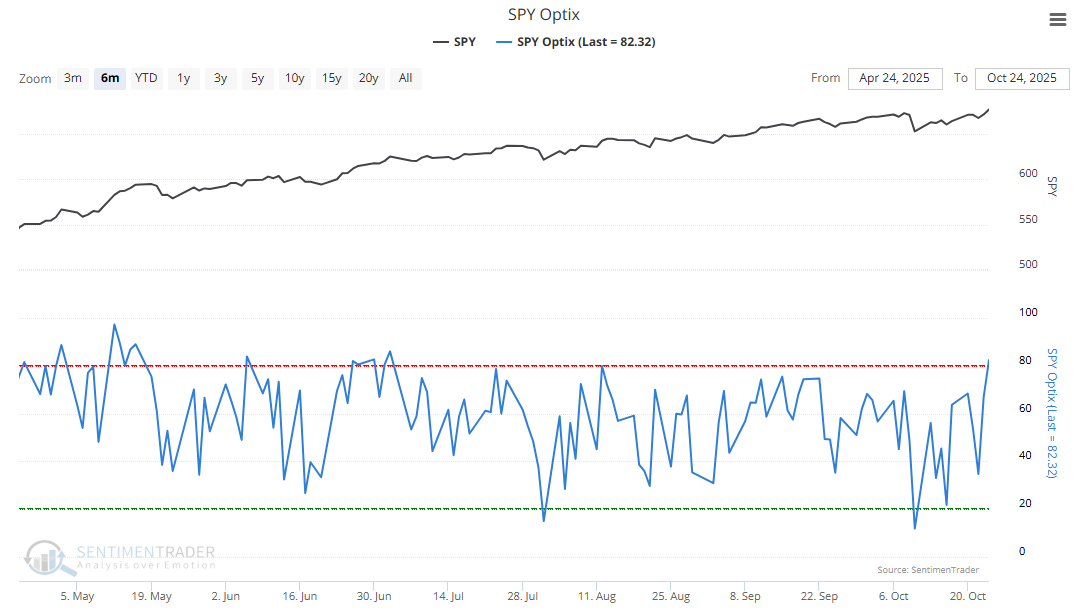
Above 70 (Excessive Optimism): Suggests confidence and complacency are elevated. Historically, such levels often appear near short-term peaks or pauses in rallies.
Below 30 (Excessive Pessimism): Indicates widespread caution or fear, often aligning with short-term market rebounds as sentiment improves from depressed levels.
20–80 (Neutral Zone): Reflects balanced sentiment, allowing existing price trends to continue without emotional extremes.
Behavioral Application: Traders monitor how quickly the Optix shifts between zones to gauge momentum in crowd psychology—fast reversals can signal emotional whiplash and higher volatility.
The Technical Bit
Calculation and components
The SPY Optimism Index (Optix) is constructed from multiple market-based inputs that collectively capture trader sentiment toward the S&P 500 ETF:
Put/Call Ratios: Compare bearish versus bullish options activity, highlighting speculative demand.
Future Volatility Expectations: Incorporate implied volatility measures to reflect perceived risk levels.
Average Discount/Premium to Net Asset Value (NAV): Evaluates whether SPY is trading above or below its underlying asset value, signaling demand intensity.
Price Behavior: Considers short-term performance relative to historical norms to capture crowd reaction to recent moves.
Each input is ranked against its own history to identify extremes and then combined into a composite score ranging from 0 (maximum pessimism) to 100 (maximum optimism). In practice, the indicator typically fluctuates between 20 and 80, with sustained readings near either boundary serving as contrarian alerts.
What This Means for Traders
SPY Optix translates real-time market activity into an emotional barometer for the S&P 500 ETF. When optimism runs too high, expectations often outpace reality; when fear dominates, conditions may set the stage for a relief rally.
Because sentiment extremes can persist, SPY Optix is best used alongside trend or momentum indicators to confirm whether crowd emotions align with price direction.
This is a proprietary SentimenTrader interpretation, updated daily and available exclusively to subscribers. It can also be explored through SentimenTrader’s Proprietary Backtest Engine to quantify how short-term optimism and pessimism toward SPY have historically influenced market outcomes.