Why the Advisor & Investor Model Matters
Investor surveys offer a direct glimpse into how the crowd is feeling about future market direction. When optimism or pessimism becomes extreme, it often reflects emotional exhaustion rather than rational forecasting.
Clarity: Consolidates multiple investor and advisor sentiment surveys into one coherent weekly reading.
Context: Highlights when optimism or pessimism has reached statistically excessive levels relative to recent history.
Insight: Helps identify when the majority’s conviction is stretched — a classic setup for contrarian opportunities.
How Traders Use the Advisor & Investor Model
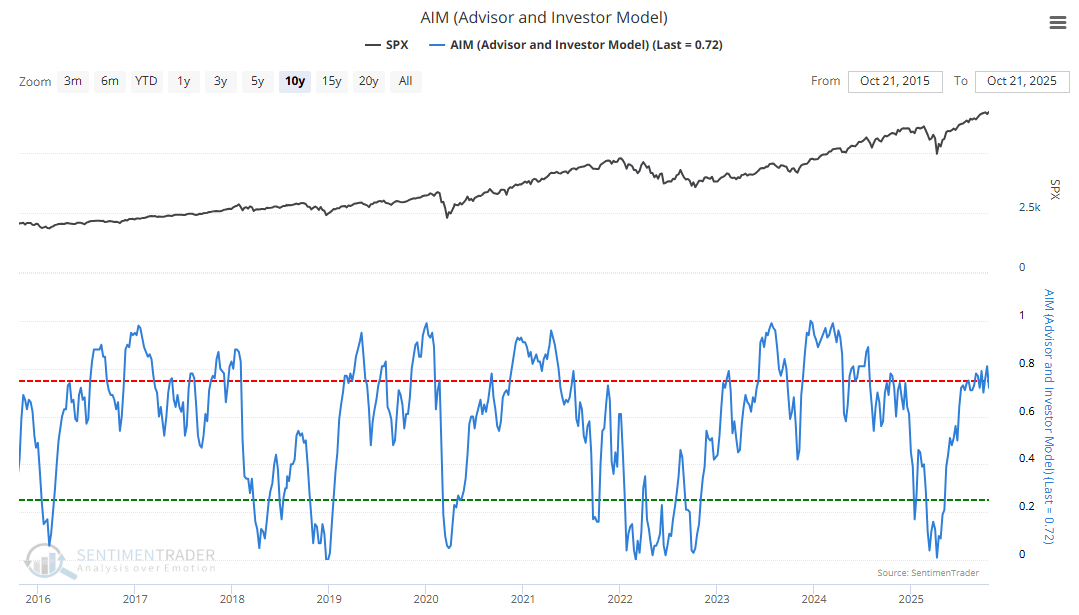
Extreme Optimism (Near Upper Red Band): Indicates that a majority of survey respondents are highly bullish. Historically, this has often occurred near market peaks when further upside support is limited.
Extreme Pessimism (Near Lower Green Band): Shows widespread bearish sentiment. Such readings tend to appear near market lows when selling pressure has likely exhausted itself.
Midrange Readings: Suggest sentiment is balanced, with neither optimism nor pessimism dominating — conditions where price trends often continue.
Trend Confirmation: Signals become more reliable when aligned with a rising 40-week moving average, suggesting the broader market tone is supportive.
The Technical Bit
Calculation and components
The Advisor & Investor Model (AIM) is computed weekly from sentiment readings across multiple advisor and investor surveys. It is designed around the behavioral observation that the majority tends to be most bullish near market highs and most bearish near lows.
When a large share of survey respondents report high optimism, AIM rises toward its upper red trading band, signaling potential complacency and limited buying power remaining in the market.
Conversely, when readings fall toward or below the lower green trading band, sentiment has reached pessimistic extremes — conditions that often precede rebounds.
These sentiment shifts don’t predict exact timing but highlight when crowd emotion is at an unsustainable extreme. Because market cycles are emotional, these zones often serve as early warnings of a changing tide.
What This Means for Traders
The AIM condenses crowd mood into a single, easy-to-read line — a reflection of how advisors and investors collectively feel about market prospects. By identifying moments when confidence or fear is overextended, traders gain context about the psychological backdrop driving market moves.
While the AIM can reveal valuable turning points, extremes can persist. Many traders therefore pair it with trend or momentum indicators to confirm whether market direction aligns with sentiment.
This is a proprietary SentimenTrader sentiment indicator, updated weekly and available exclusively to subscribers. It can also be explored through SentimenTrader’s Proprietary Backtest Engine to quantify how advisor and investor sentiment extremes have historically influenced major market turning points.