Why Chaikin Money Flow Matters
Price alone doesn’t reveal the full story of market sentiment. The Chaikin Money Flow goes deeper by blending price and volume to highlight how strongly traders are supporting a move — whether they’re accumulating positions or distributing them.
Trend Strength: Quantifies whether sustained buying or selling pressure is supporting a move, not just day-to-day swings.
Volume Insight: Integrates both price position and trading volume over time, revealing whether participation is increasing or fading.
Flexibility: Adapts easily across timeframes — from short-term signals to long-term confirmation of accumulation or distribution trends.
How Traders Use Chaikin Money Flow
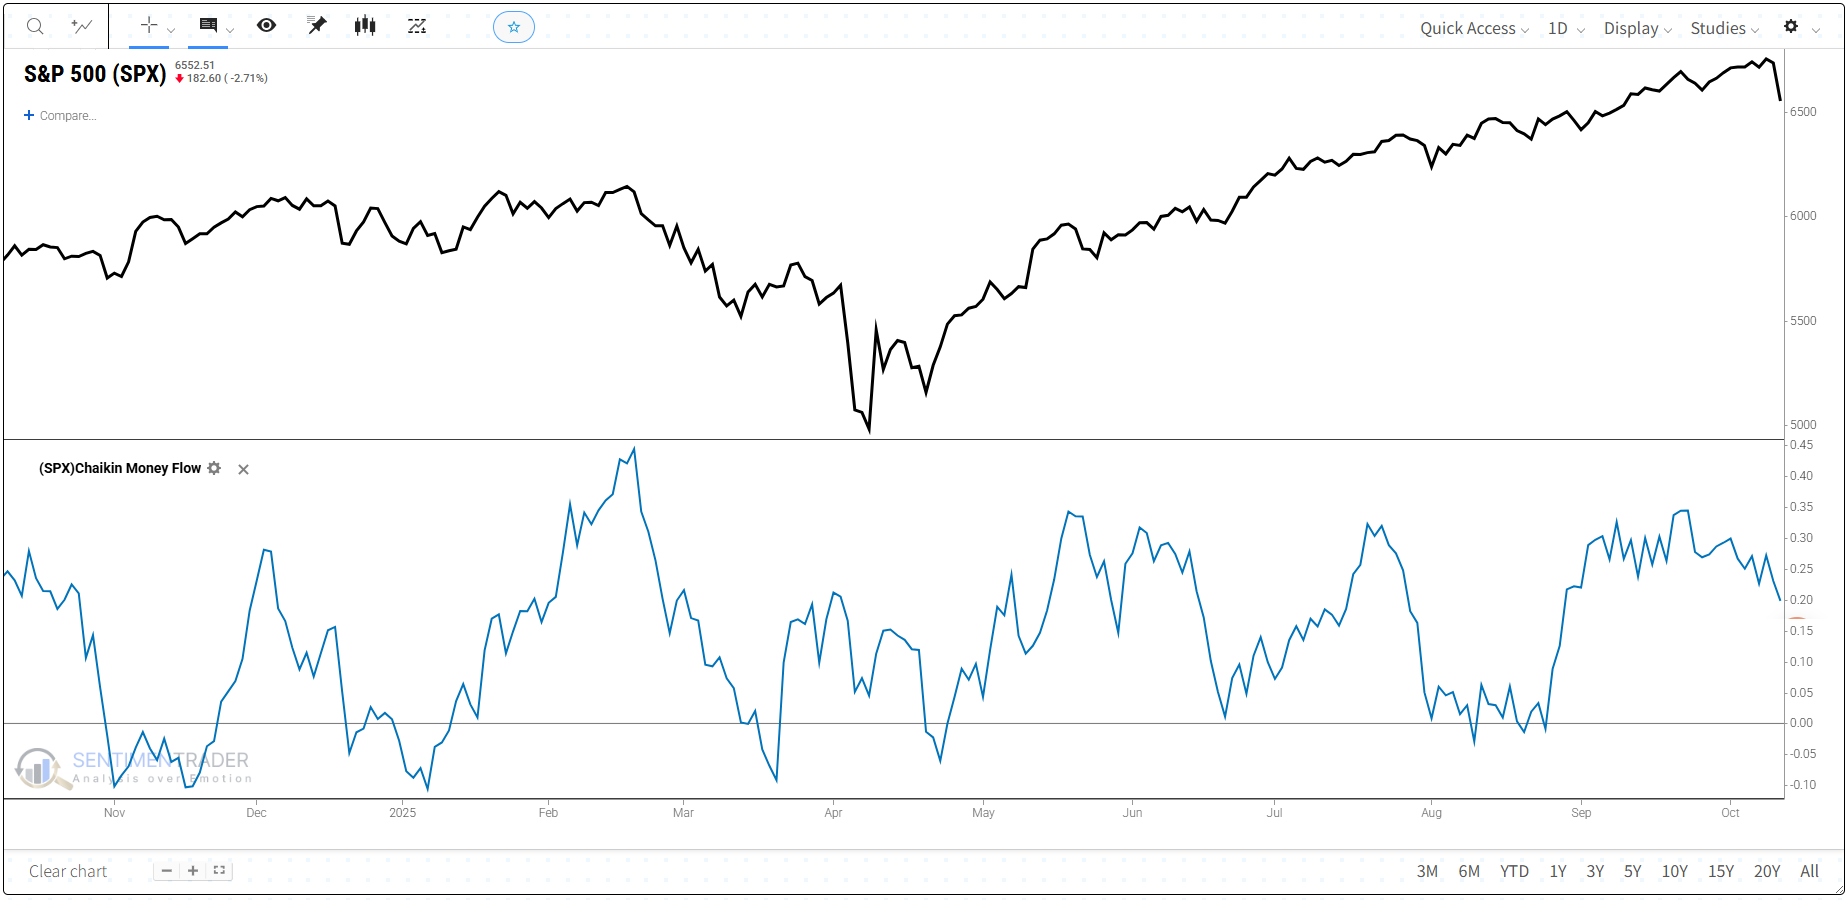
Zero-line crossovers: When CMF moves above zero, buying pressure dominates; when it drops below, selling pressure takes over. Sustained readings on either side often confirm ongoing trends.
Divergences: If price makes a new high but CMF doesn’t, it signals fading buying pressure. If price hits a new low while CMF holds higher, it may show weakening selling pressure.
Trend confirmation: Consistent positive CMF readings reinforce an uptrend’s strength, while extended negative readings confirm downward pressure.
Real-World Results: Do They Actually Work?
A backtest on the Energy Select Sector SPDR Fund (XLE) shows how a Chaikin Money Flow–based strategy helped reduce drawdowns and selectively participate in accumulation phases over the past 10 years.
Buy: When Chaikin Money Flow stays above zero (indicating sustained buying pressure) and price is above its 21-day simple moving average
Sell: When CMF crosses below −0.15, signaling fading accumulation, or when price falls back below the 21-day simple moving average.
Results over 10 years:
+46.9% total return (vs. +32.9% for buy-and-hold).
Smaller drawdowns: –29.6% max risk vs. roughly –70% during the 2020 energy-sector collapse.
Reduced exposure: In the market about 43.6% of the time, limiting prolonged downside participation.
Takeaway: This case study highlights how Chaikin Money Flow can be used as a confirmation and risk-filtering tool to help reduce drawdowns and align exposure with accumulation phases.
This backtest was run using SentimenTrader’s Proprietary Backtest Engine, which lets you test your strategy with nearly 100 technical indicators and over 17,000 proprietary sentiment indicators—no coding required.
The Technical Bit
Calculation and Components
1. Calculate the Money Flow Multiplier (MFM): This value shows where a security closed relative to its range for the period.
Where Close = close price, High = high price, Low = low price.
This value ranges from -1 to +1, showing whether price closed near the high (buying pressure) or near the low (selling pressure).
2. Calculate Money Flow Volume: This step multiplies the MFM by the volume for the period to quantify the amount of money flowing in or out.
This step incorporates both price position and trading activity to quantify inflows or outflows.
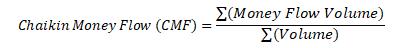
3. Compute the Chaikin Money Flow (CMF): The CMF is the sum of Money Flow Volume over a specific period divided by the sum of all volume over that same period.
The calculation is typically based on a 21-day period, aligning with one trading month. The result oscillates between -1 and +1, where positive values suggest buying pressure and negative values suggest selling pressure.
Quick note on Volume: In trading, volume is the number of shares/contracts exchanged in a given period.
What This Means for Traders
Chaikin Money Flow offers a clear framework to judge trend strength through volume participation, helping traders confirm whether price moves have real conviction behind them. It’s especially useful for spotting early signs of distribution or accumulation before price reacts.
Still, CMF has limitations. It’s a lagging indicator that may produce false signals during volatile or illiquid periods. That’s why traders often combine it with other categories — for instance, Moving Averages (Trend) to verify direction, RSI (Momentum) to measure strength, or Bollinger Bands (Volatility) to gauge how extended a move is.
By using CMF alongside complementary indicators, traders can better separate real money flow trends from temporary fluctuations.


.avif)


.avif)