Why OBV Matters
Markets don’t just move on price—volume often reveals the hidden strength behind trends. OBV is designed to capture that force by tracking whether money is flowing in or out of a market.
Clarity: Turns raw trading volume into a simple running total, making it easy to spot shifts in participation.
Strength: Rising OBV confirms that a trend has real buying or selling behind it.
Flexibility: Useful for spotting divergences, confirming breakouts, and gauging trend durability across assets and timeframes.
The Technical Bit
Calculation and Components
OBV is calculated by comparing today’s close to yesterday’s close and adjusting the volume accordingly:
If today’s close is higher: OBV = Previous OBV + Today’s Volume
If today’s close is lower: OBV = Previous OBV – Today’s Volume
If today’s close is unchanged: OBV = Previous OBV
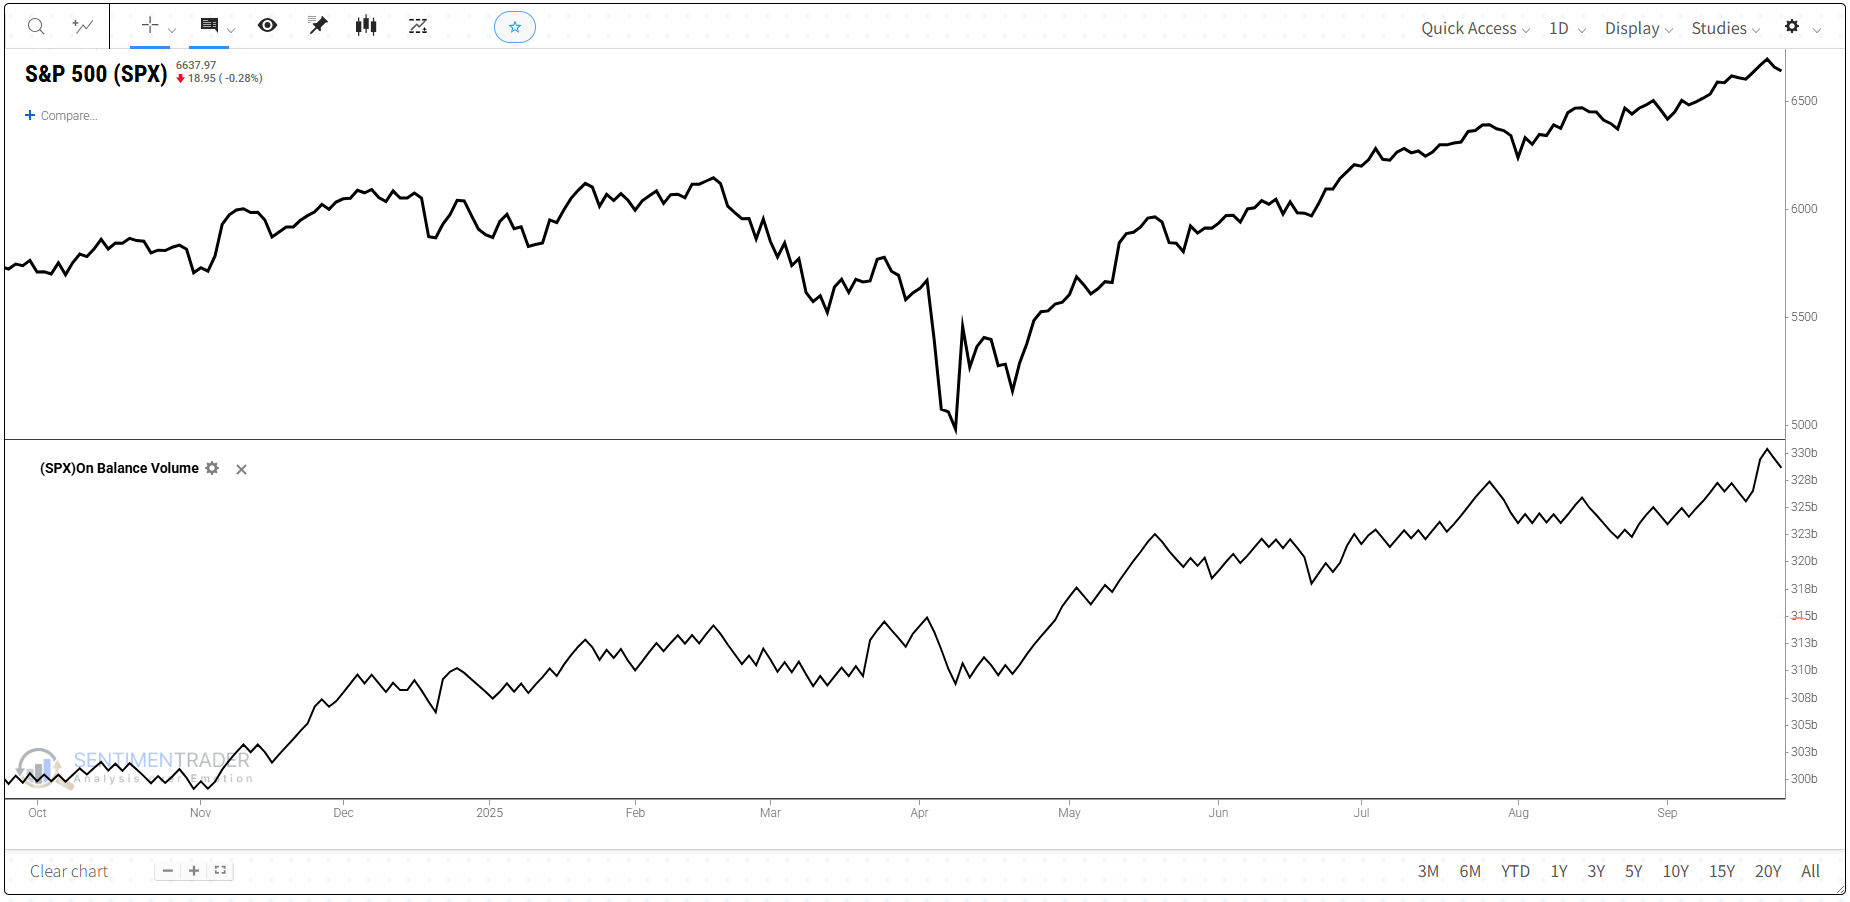
This creates a single cumulative line that rises with buying pressure and falls with selling pressure.
Quick note on Volume: In trading, volume is the number of shares/contracts exchanged in a given period. High volume often reflects institutional activity, which OBV attempts to track.
What This Means for Traders
OBV offers a way to confirm whether trends are supported by real trading activity, as well as a framework for spotting early warnings when volume and price diverge.
Still, OBV has limitations. It can generate false signals during sudden volume spikes (e.g., earnings or news events) and doesn’t provide context about the magnitude of price moves. That’s why traders often pair it with tools from other categories—for example, Moving Averages (Trend) to confirm direction, MACD (Momentum) to assess acceleration or fading of moves, or Bollinger Bands (Volatility) to gauge whether breakouts are stretched.
By combining OBV with other indicators, traders can better distinguish routine price swings from moves backed by meaningful participation.