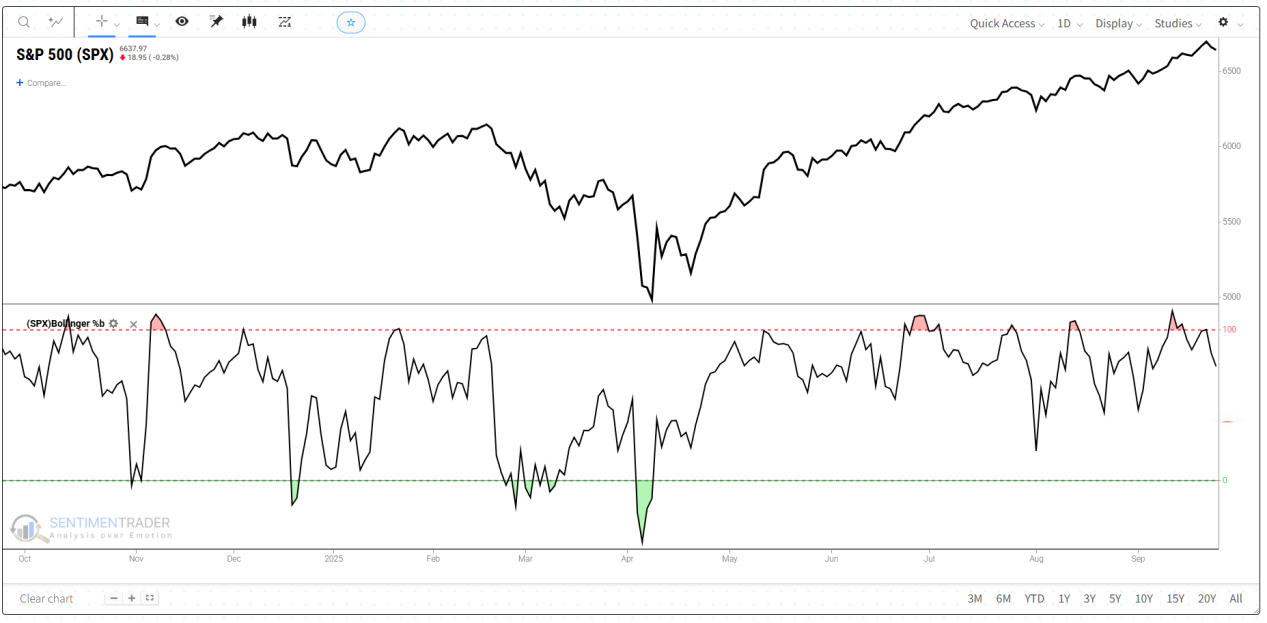
Why Bollinger %b Matters
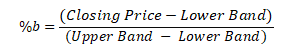
Bollinger Bands give you the boundaries of volatility, but Bollinger %b turns that into a single number. It tells you instantly whether price is stretched to the top, pressed to the bottom, or hovering near the middle.
Clarity: Converts price location into an easy-to-read scale between 0 and 1.
Comparability: Makes it simple to compare price behavior across assets and timeframes.
Signal Filter: Highlights when band touches are meaningful versus when they’re noise.
How Traders Use Bollinger %b
Overbought / Oversold checks: Above 1 = price above upper band (potential overbought). Below 0 = price under lower band (potential oversold).
Neutral conditions: A reading near 0.5 means price is right at the middle band.
Trend confirmation: Sustained readings above 0.5 align with uptrends; below 0.5 align with downtrends.
With Bollinger Bandwidth: Traders often pair %b with
Bollinger Bandwidth. For example, a narrowing Bandwidth (squeeze) plus a %b breakout above 1 or below 0 may foreshadow a strong move.
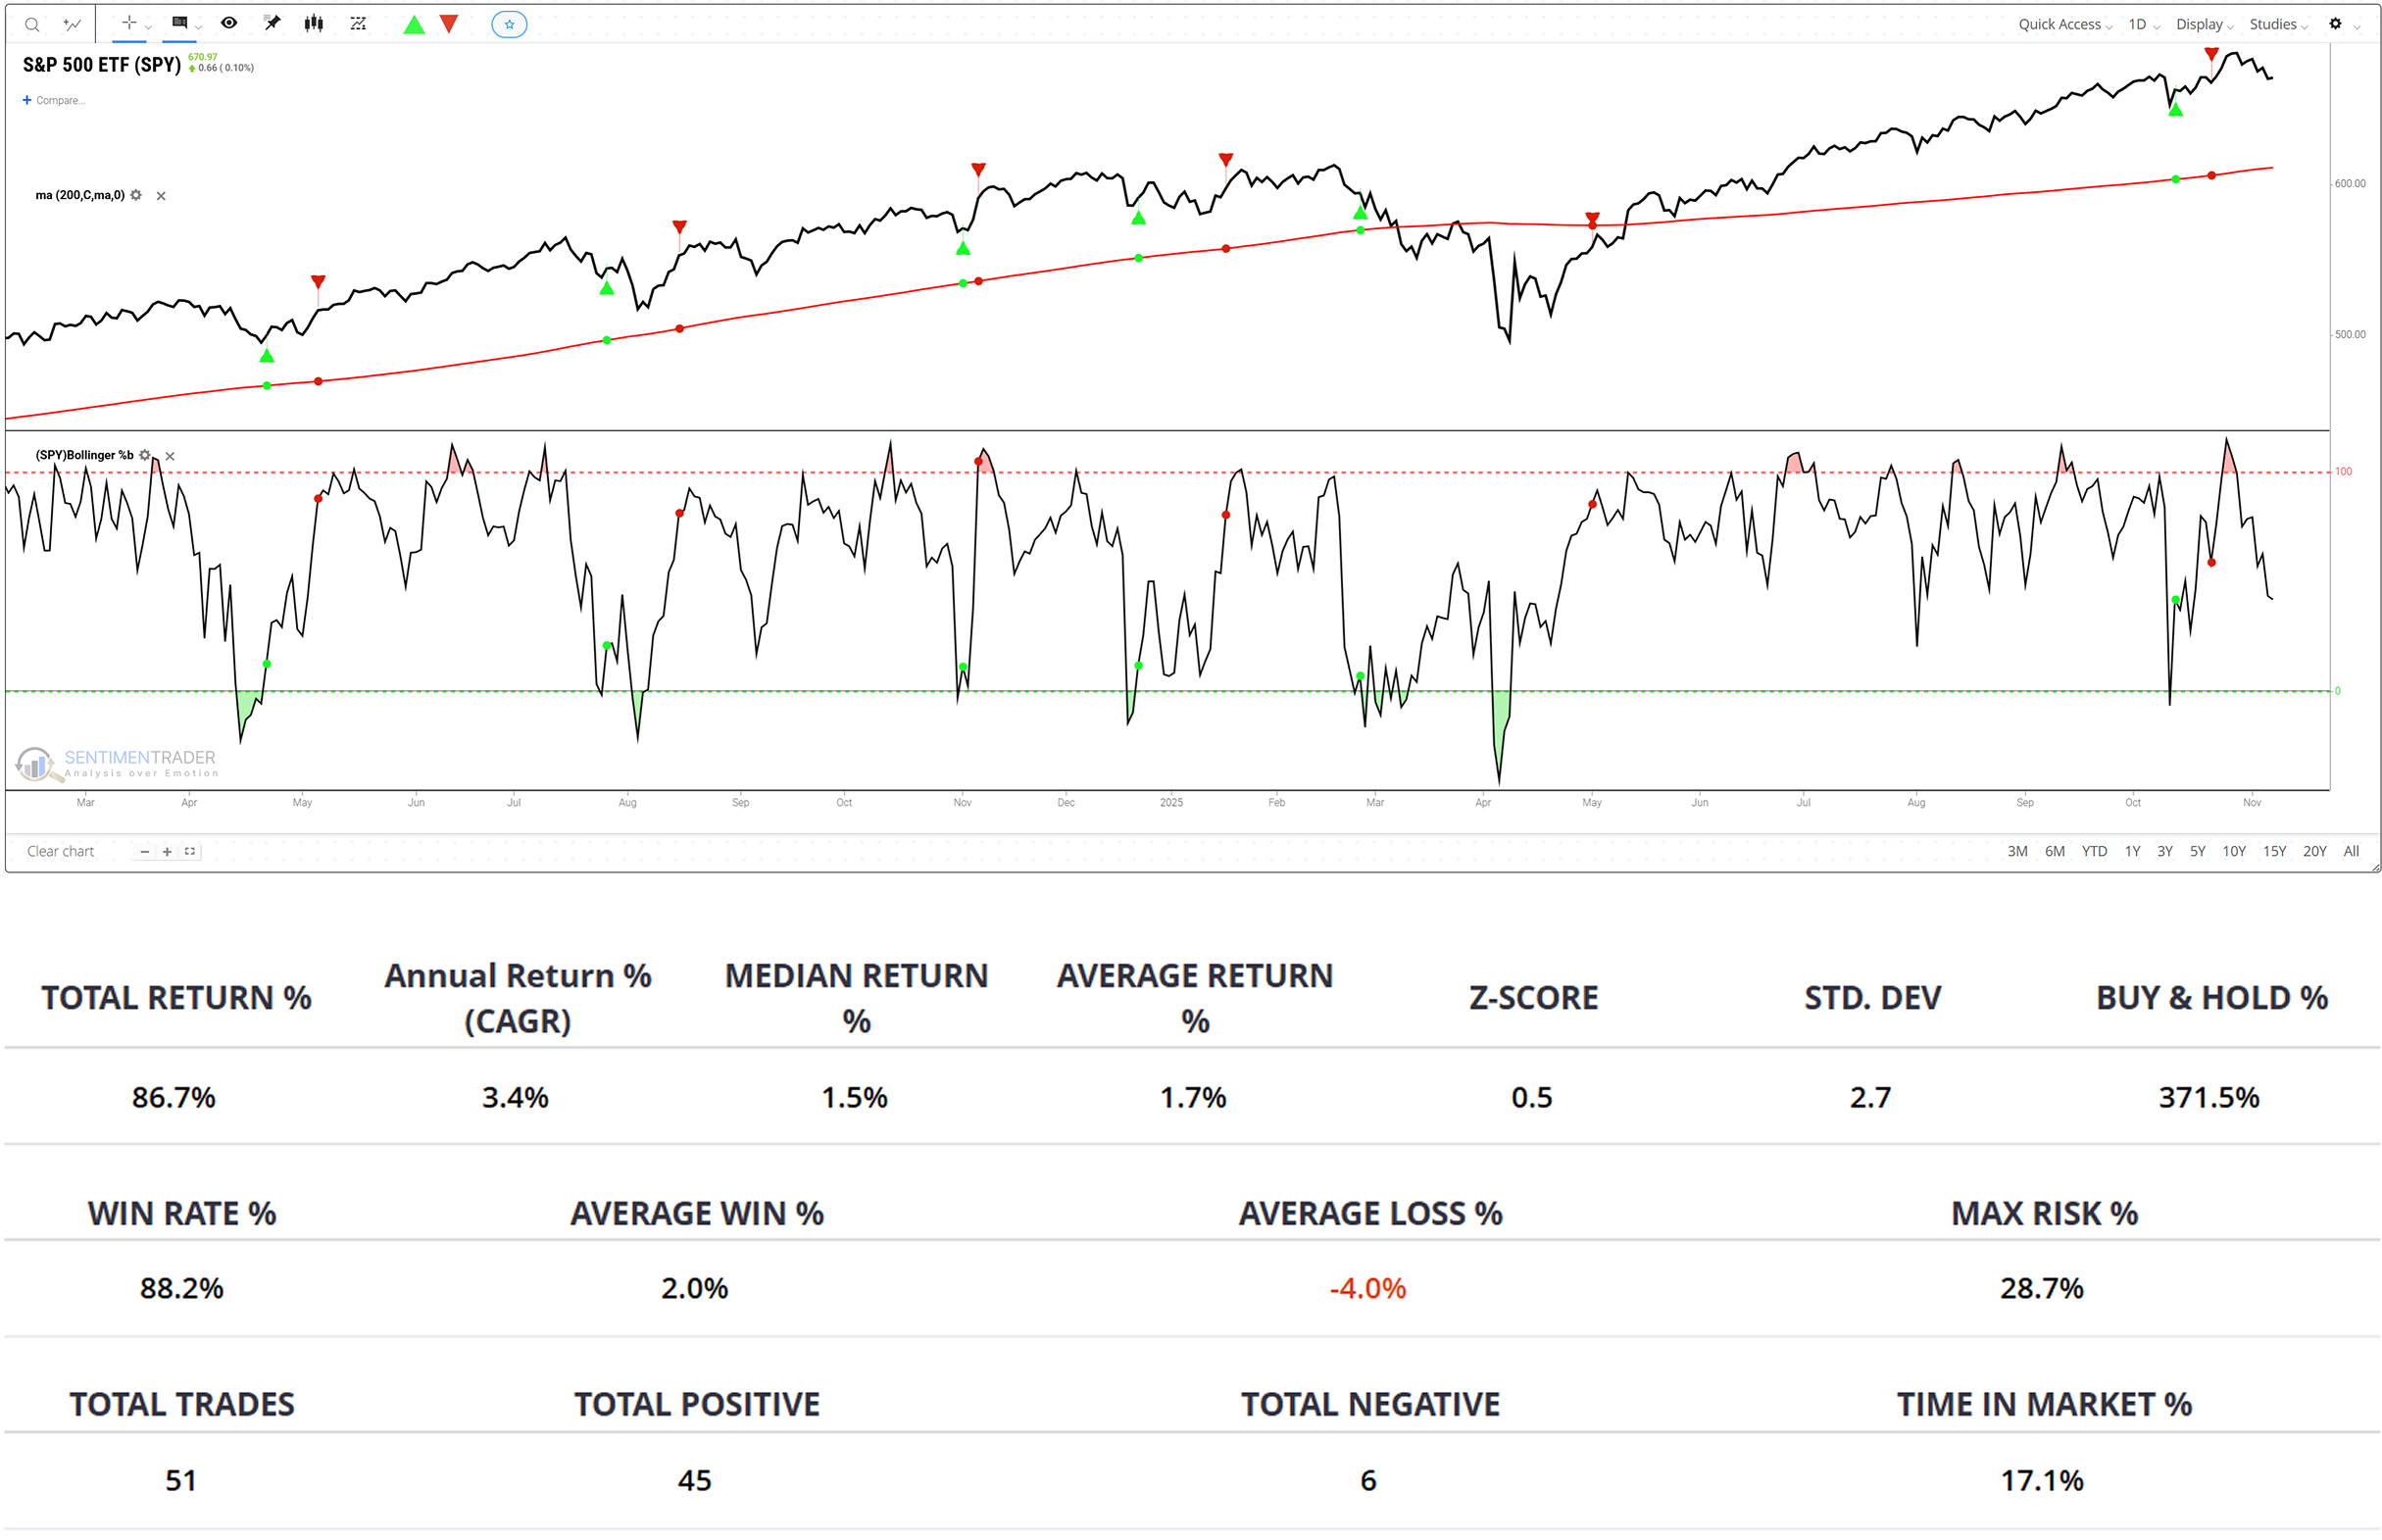
Real-World Results: Do They Actually Work?
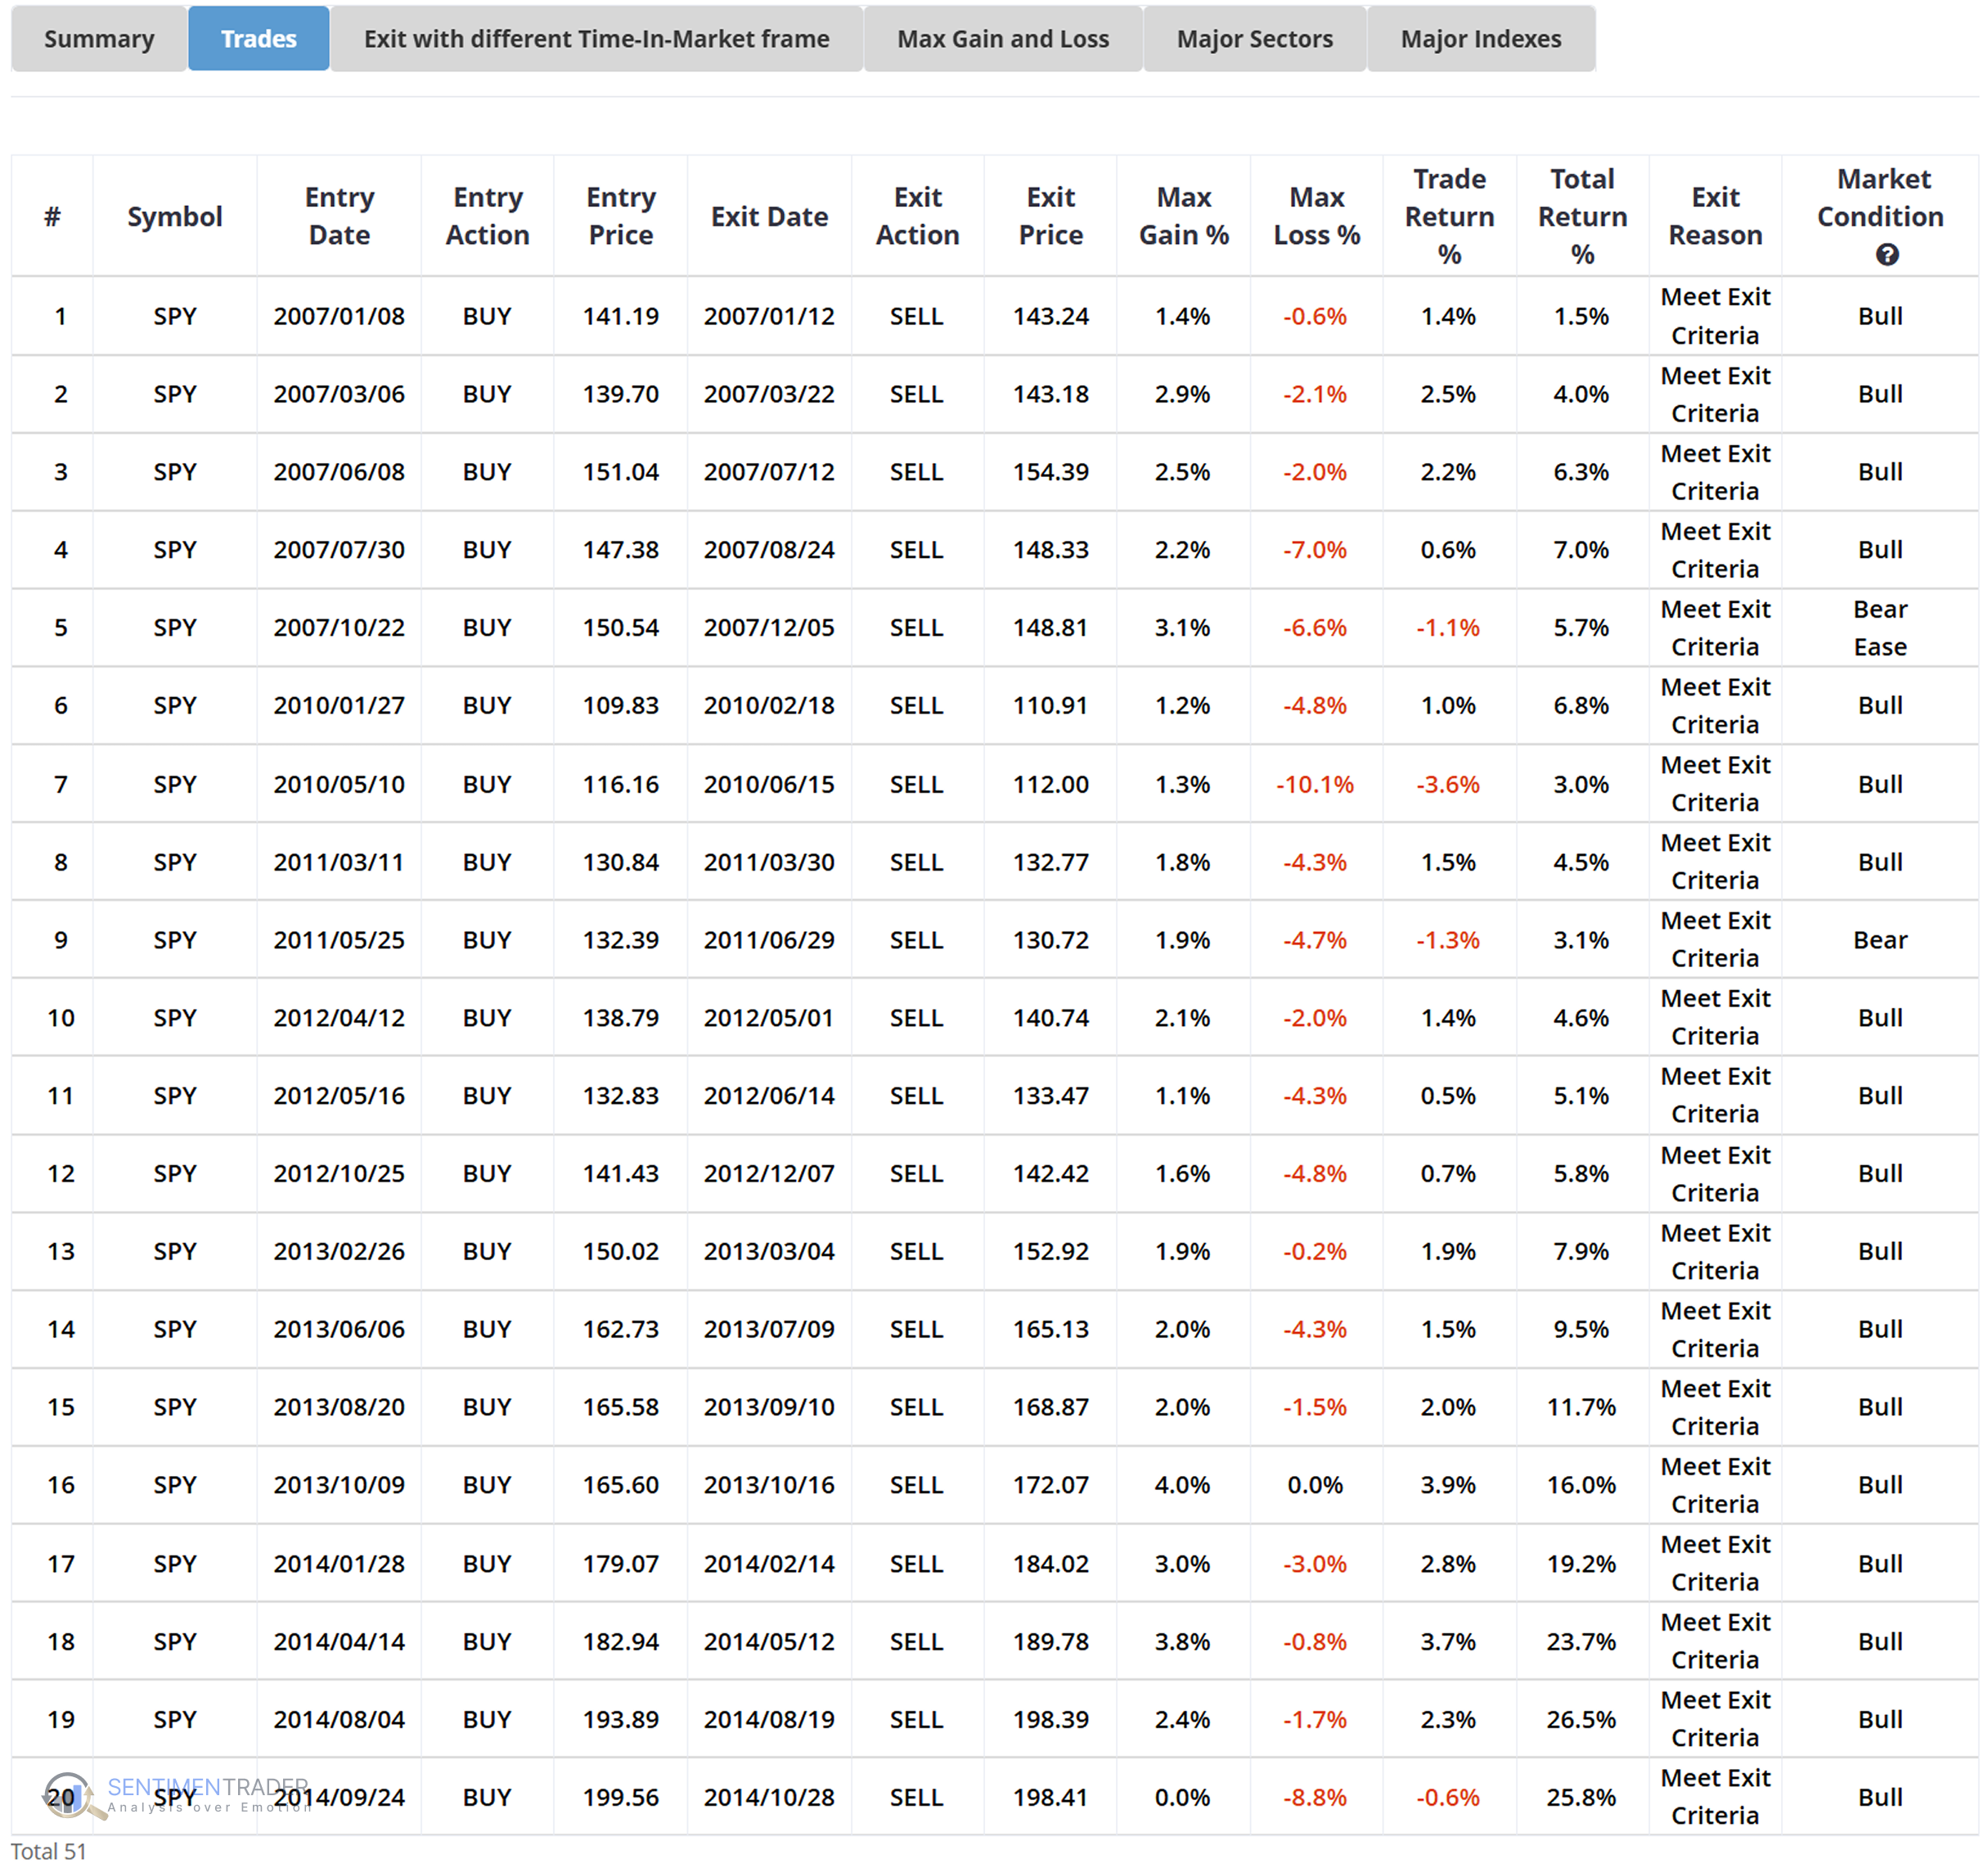
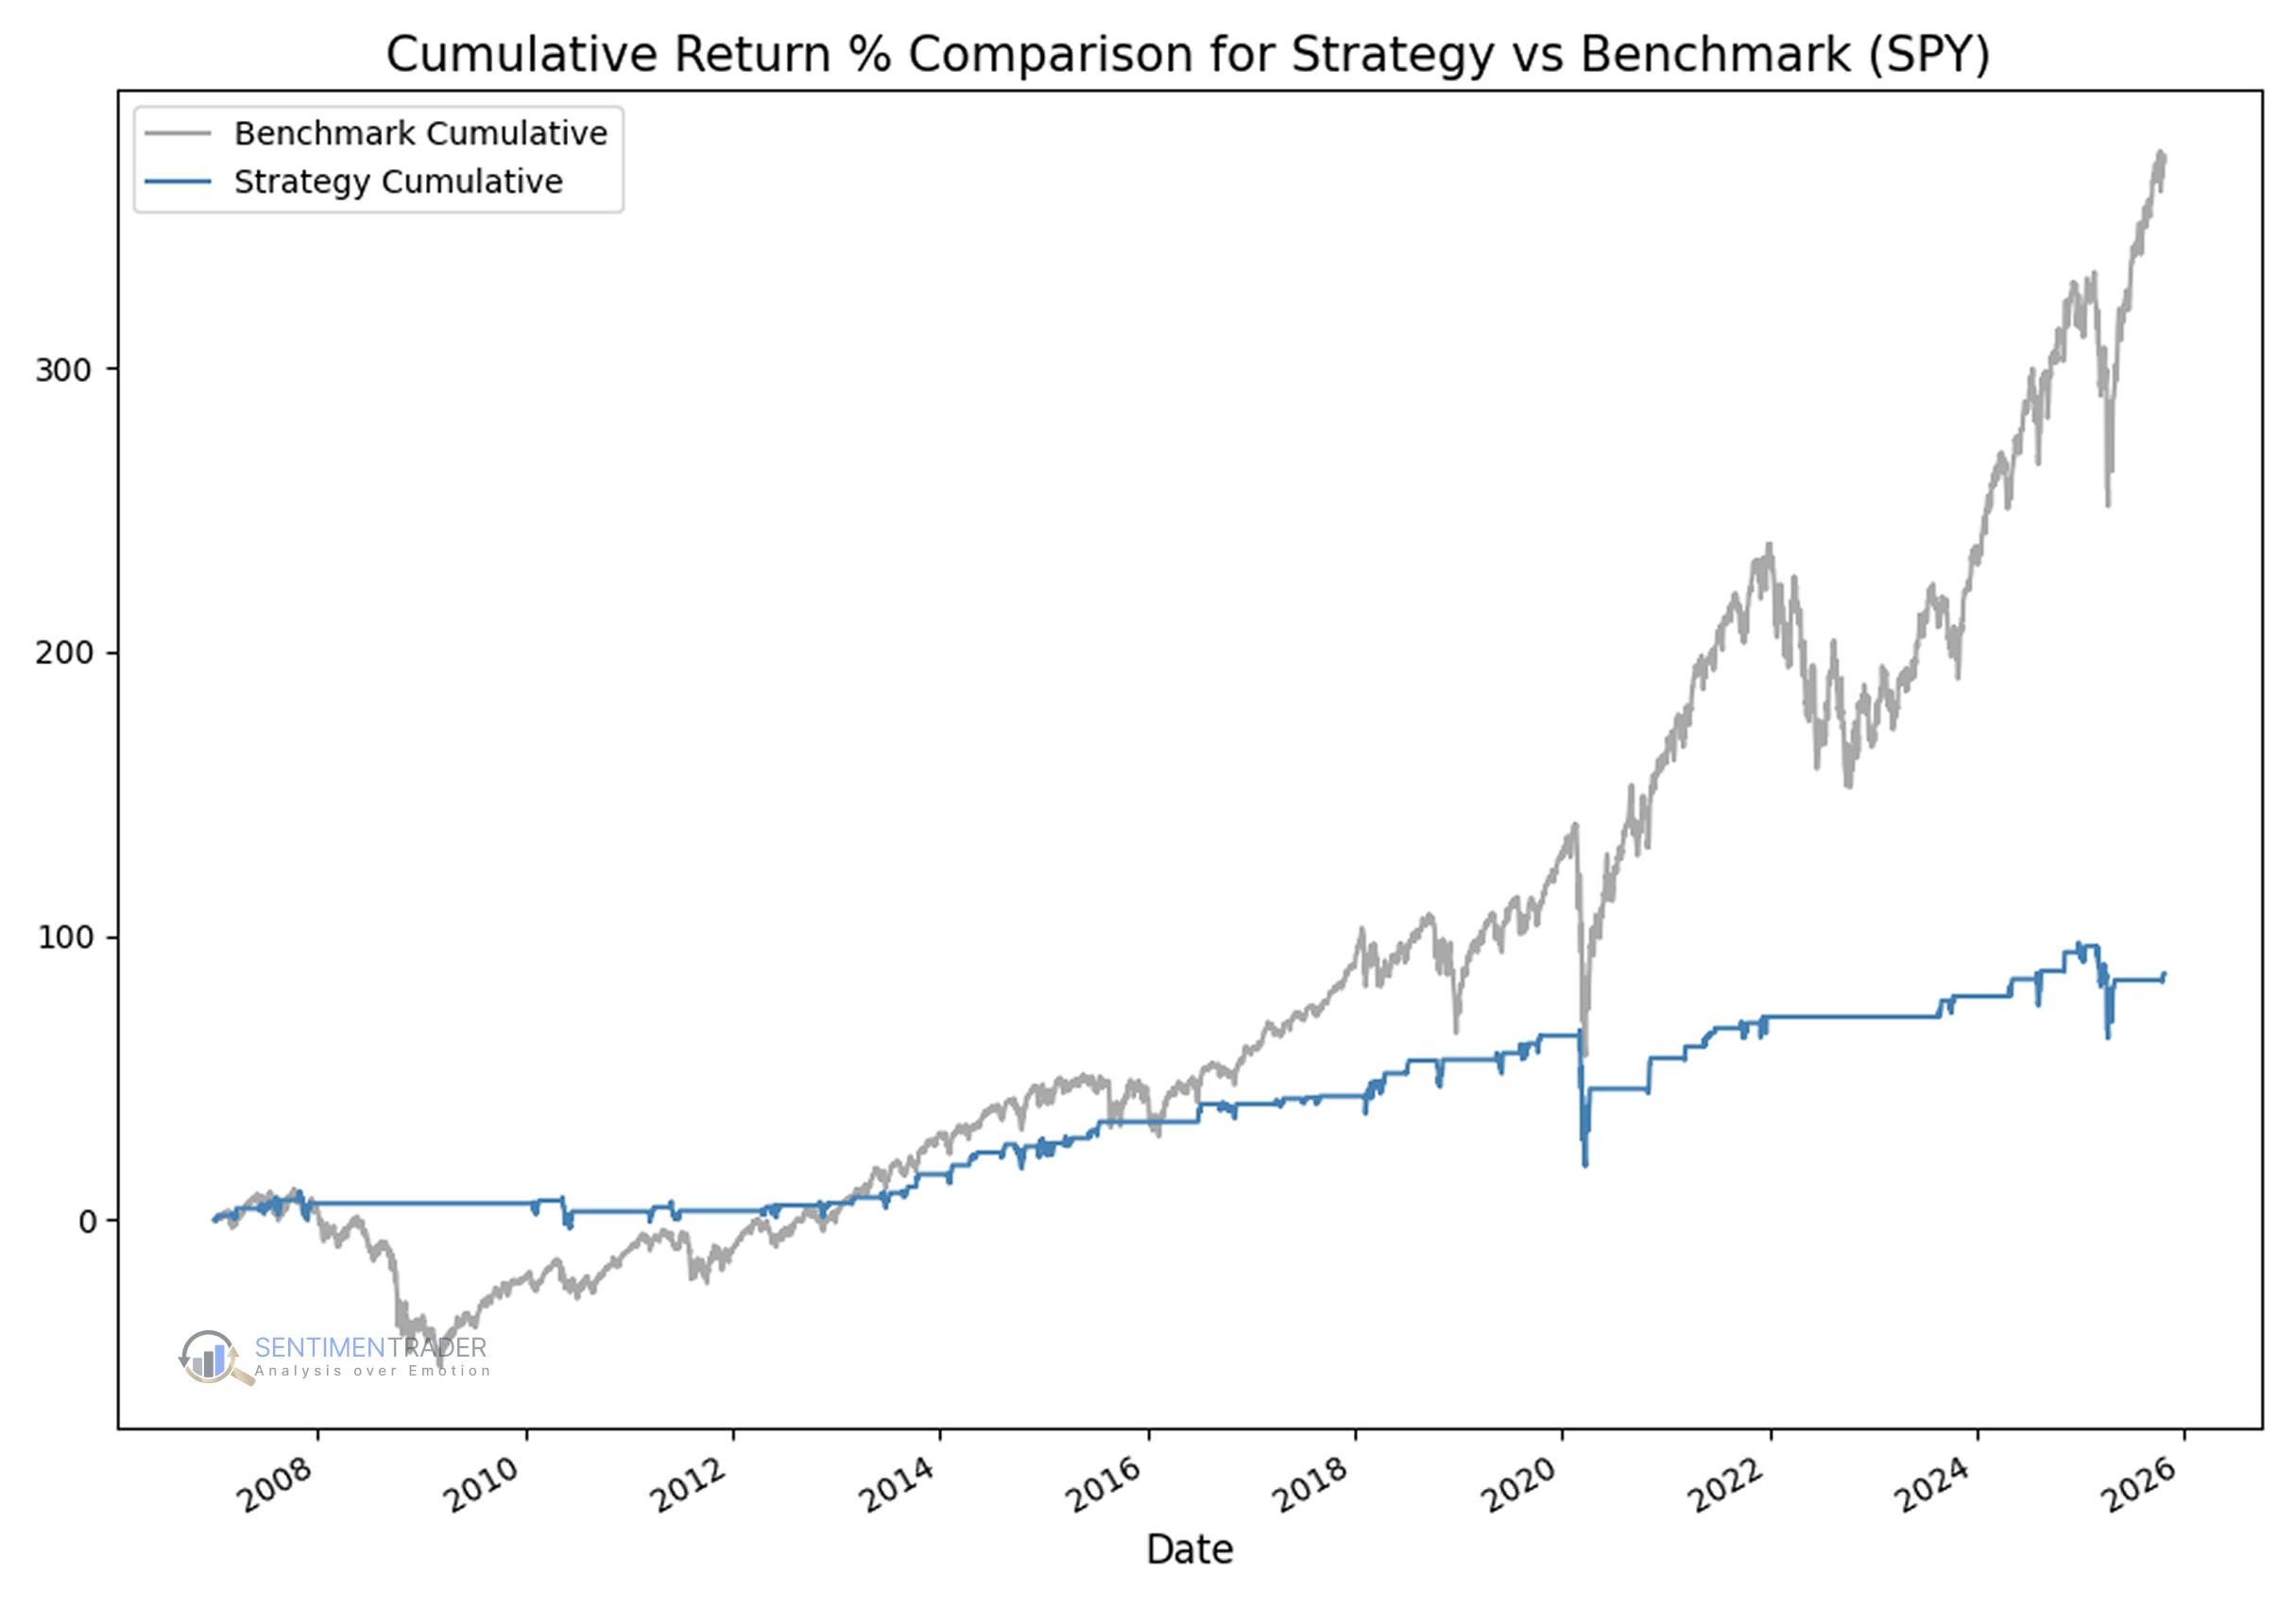
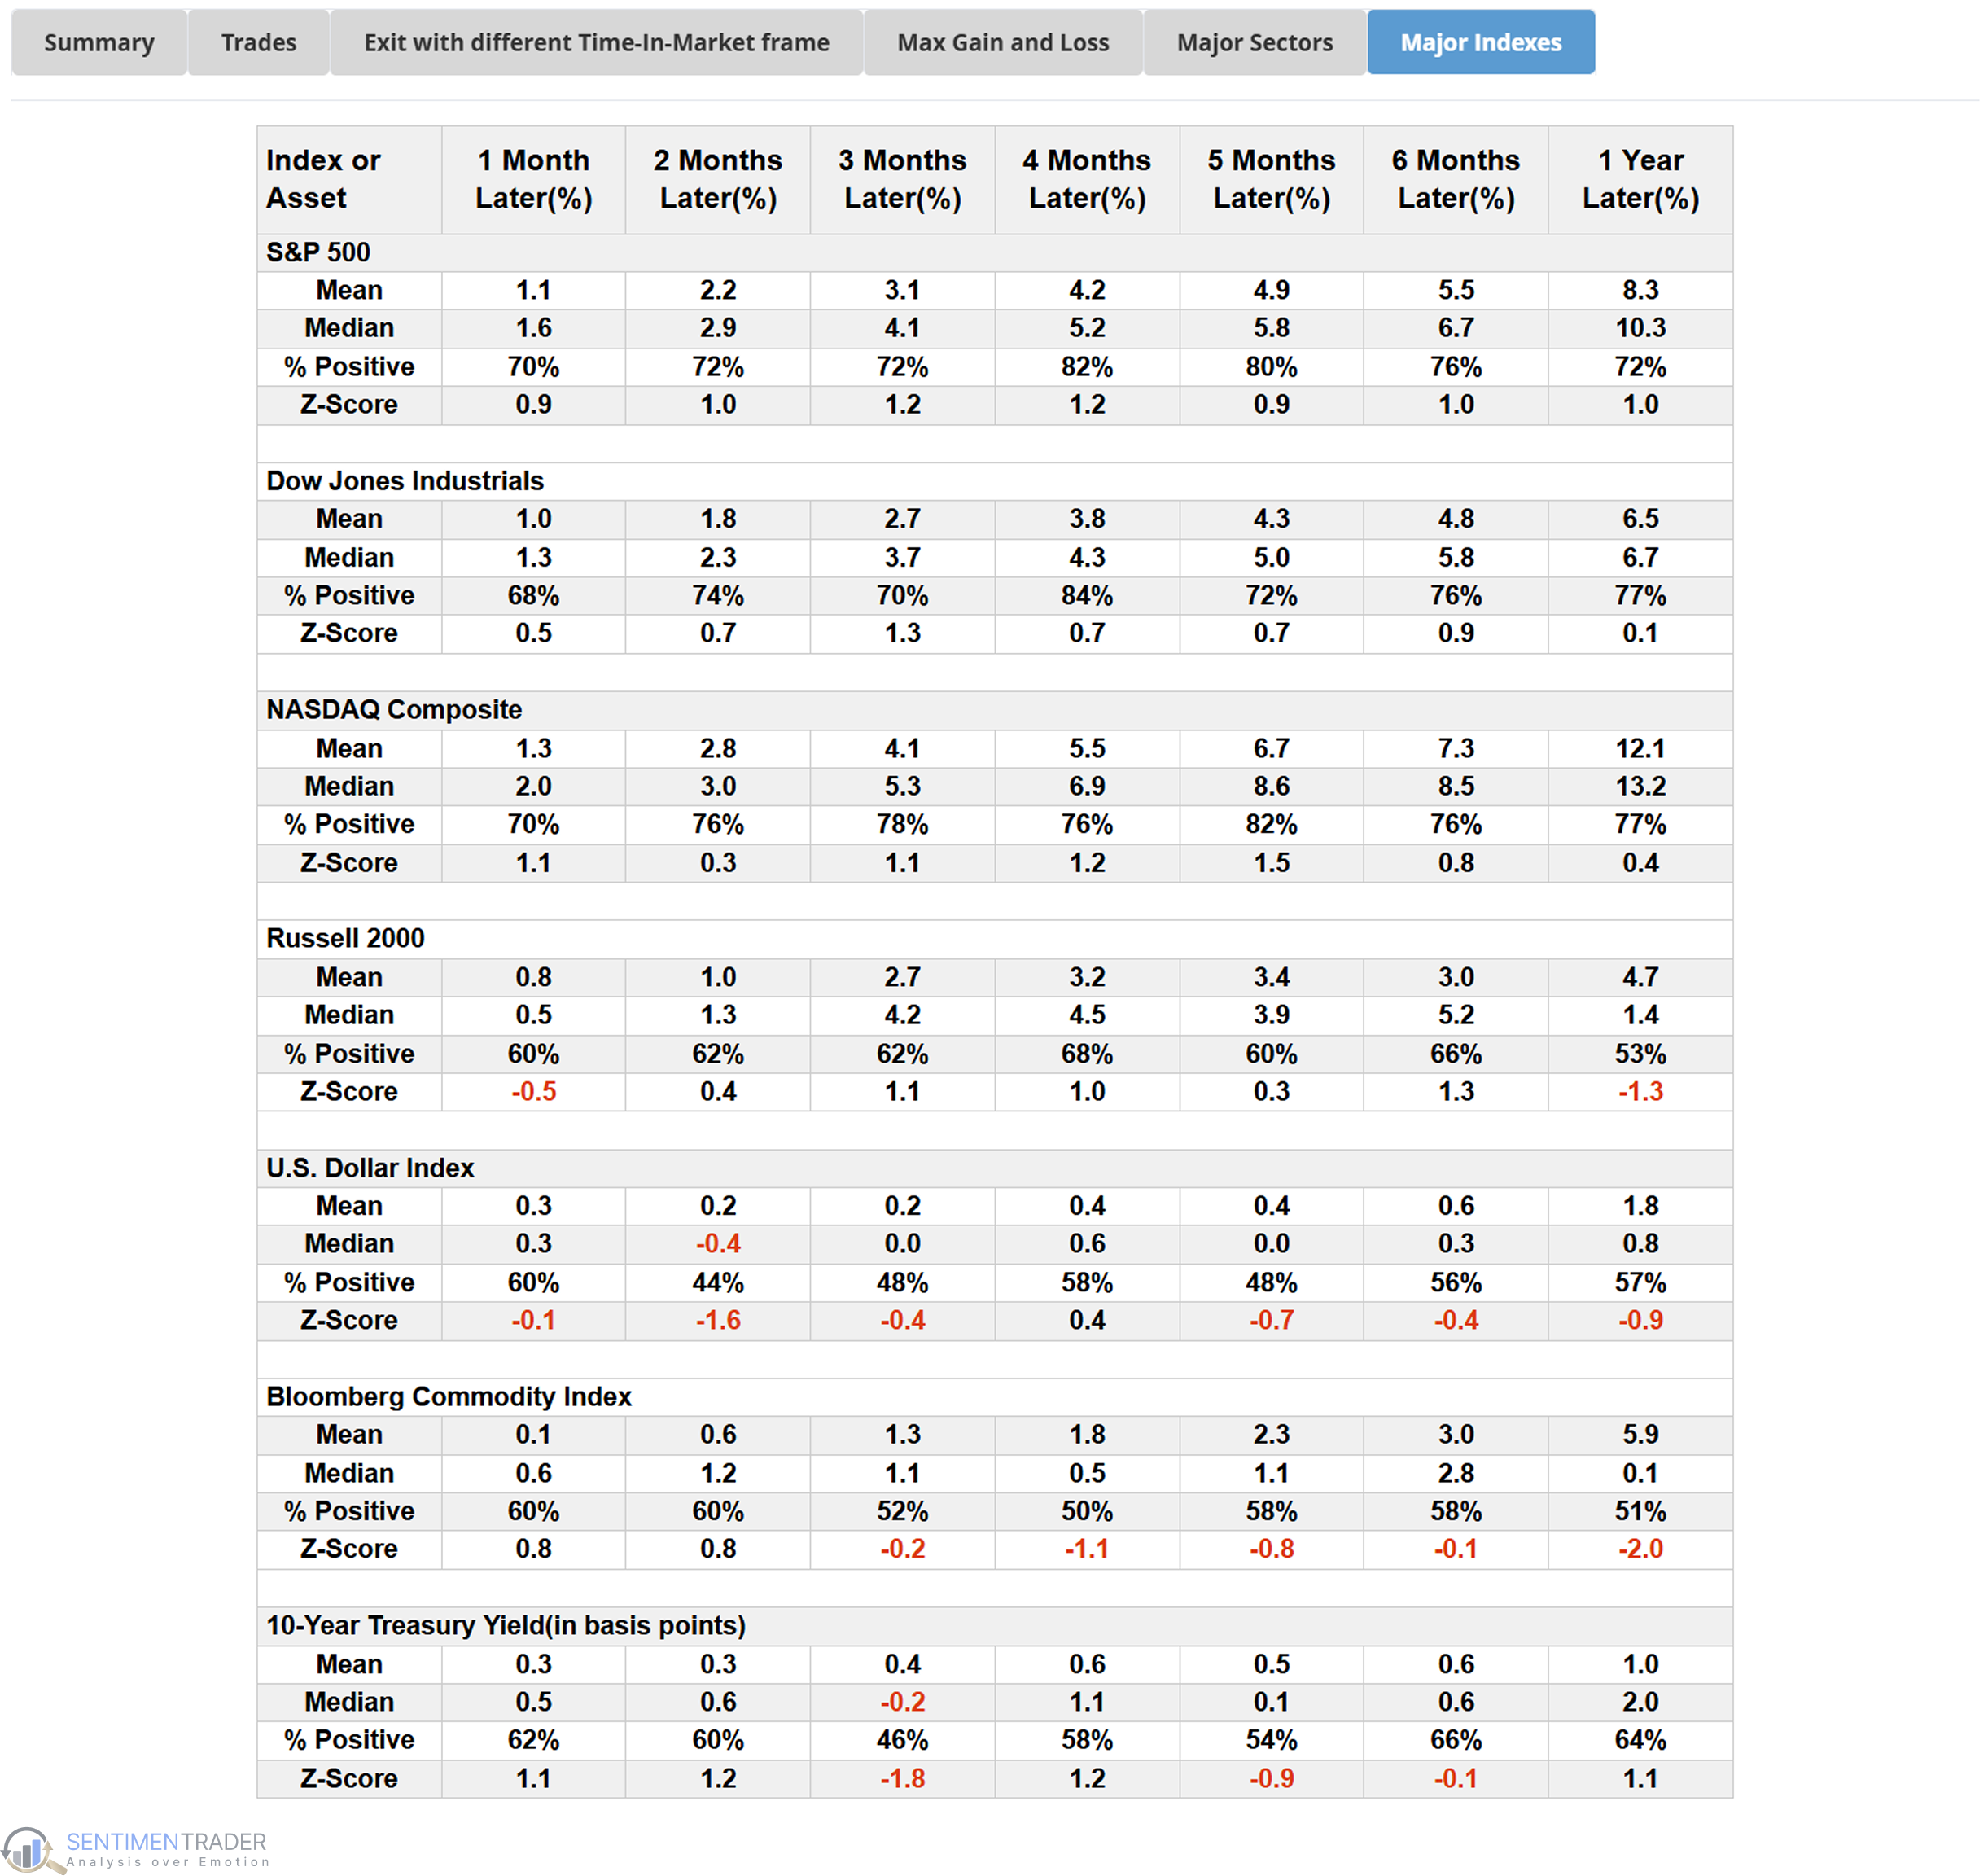
To see how Bollinger %b performs as a volatility-based rebound tool, we ran a backtest on the S&P 500 ETF (SPY) from 2007 to 2025 using a simple setup:
Buy: When %b crosses above 0 (price re-enters the lower half of its Bollinger Band range) and SPY is above its 200-day moving average.
Sell: When %b crosses above 80 (approaching the upper band, signaling stretched conditions).
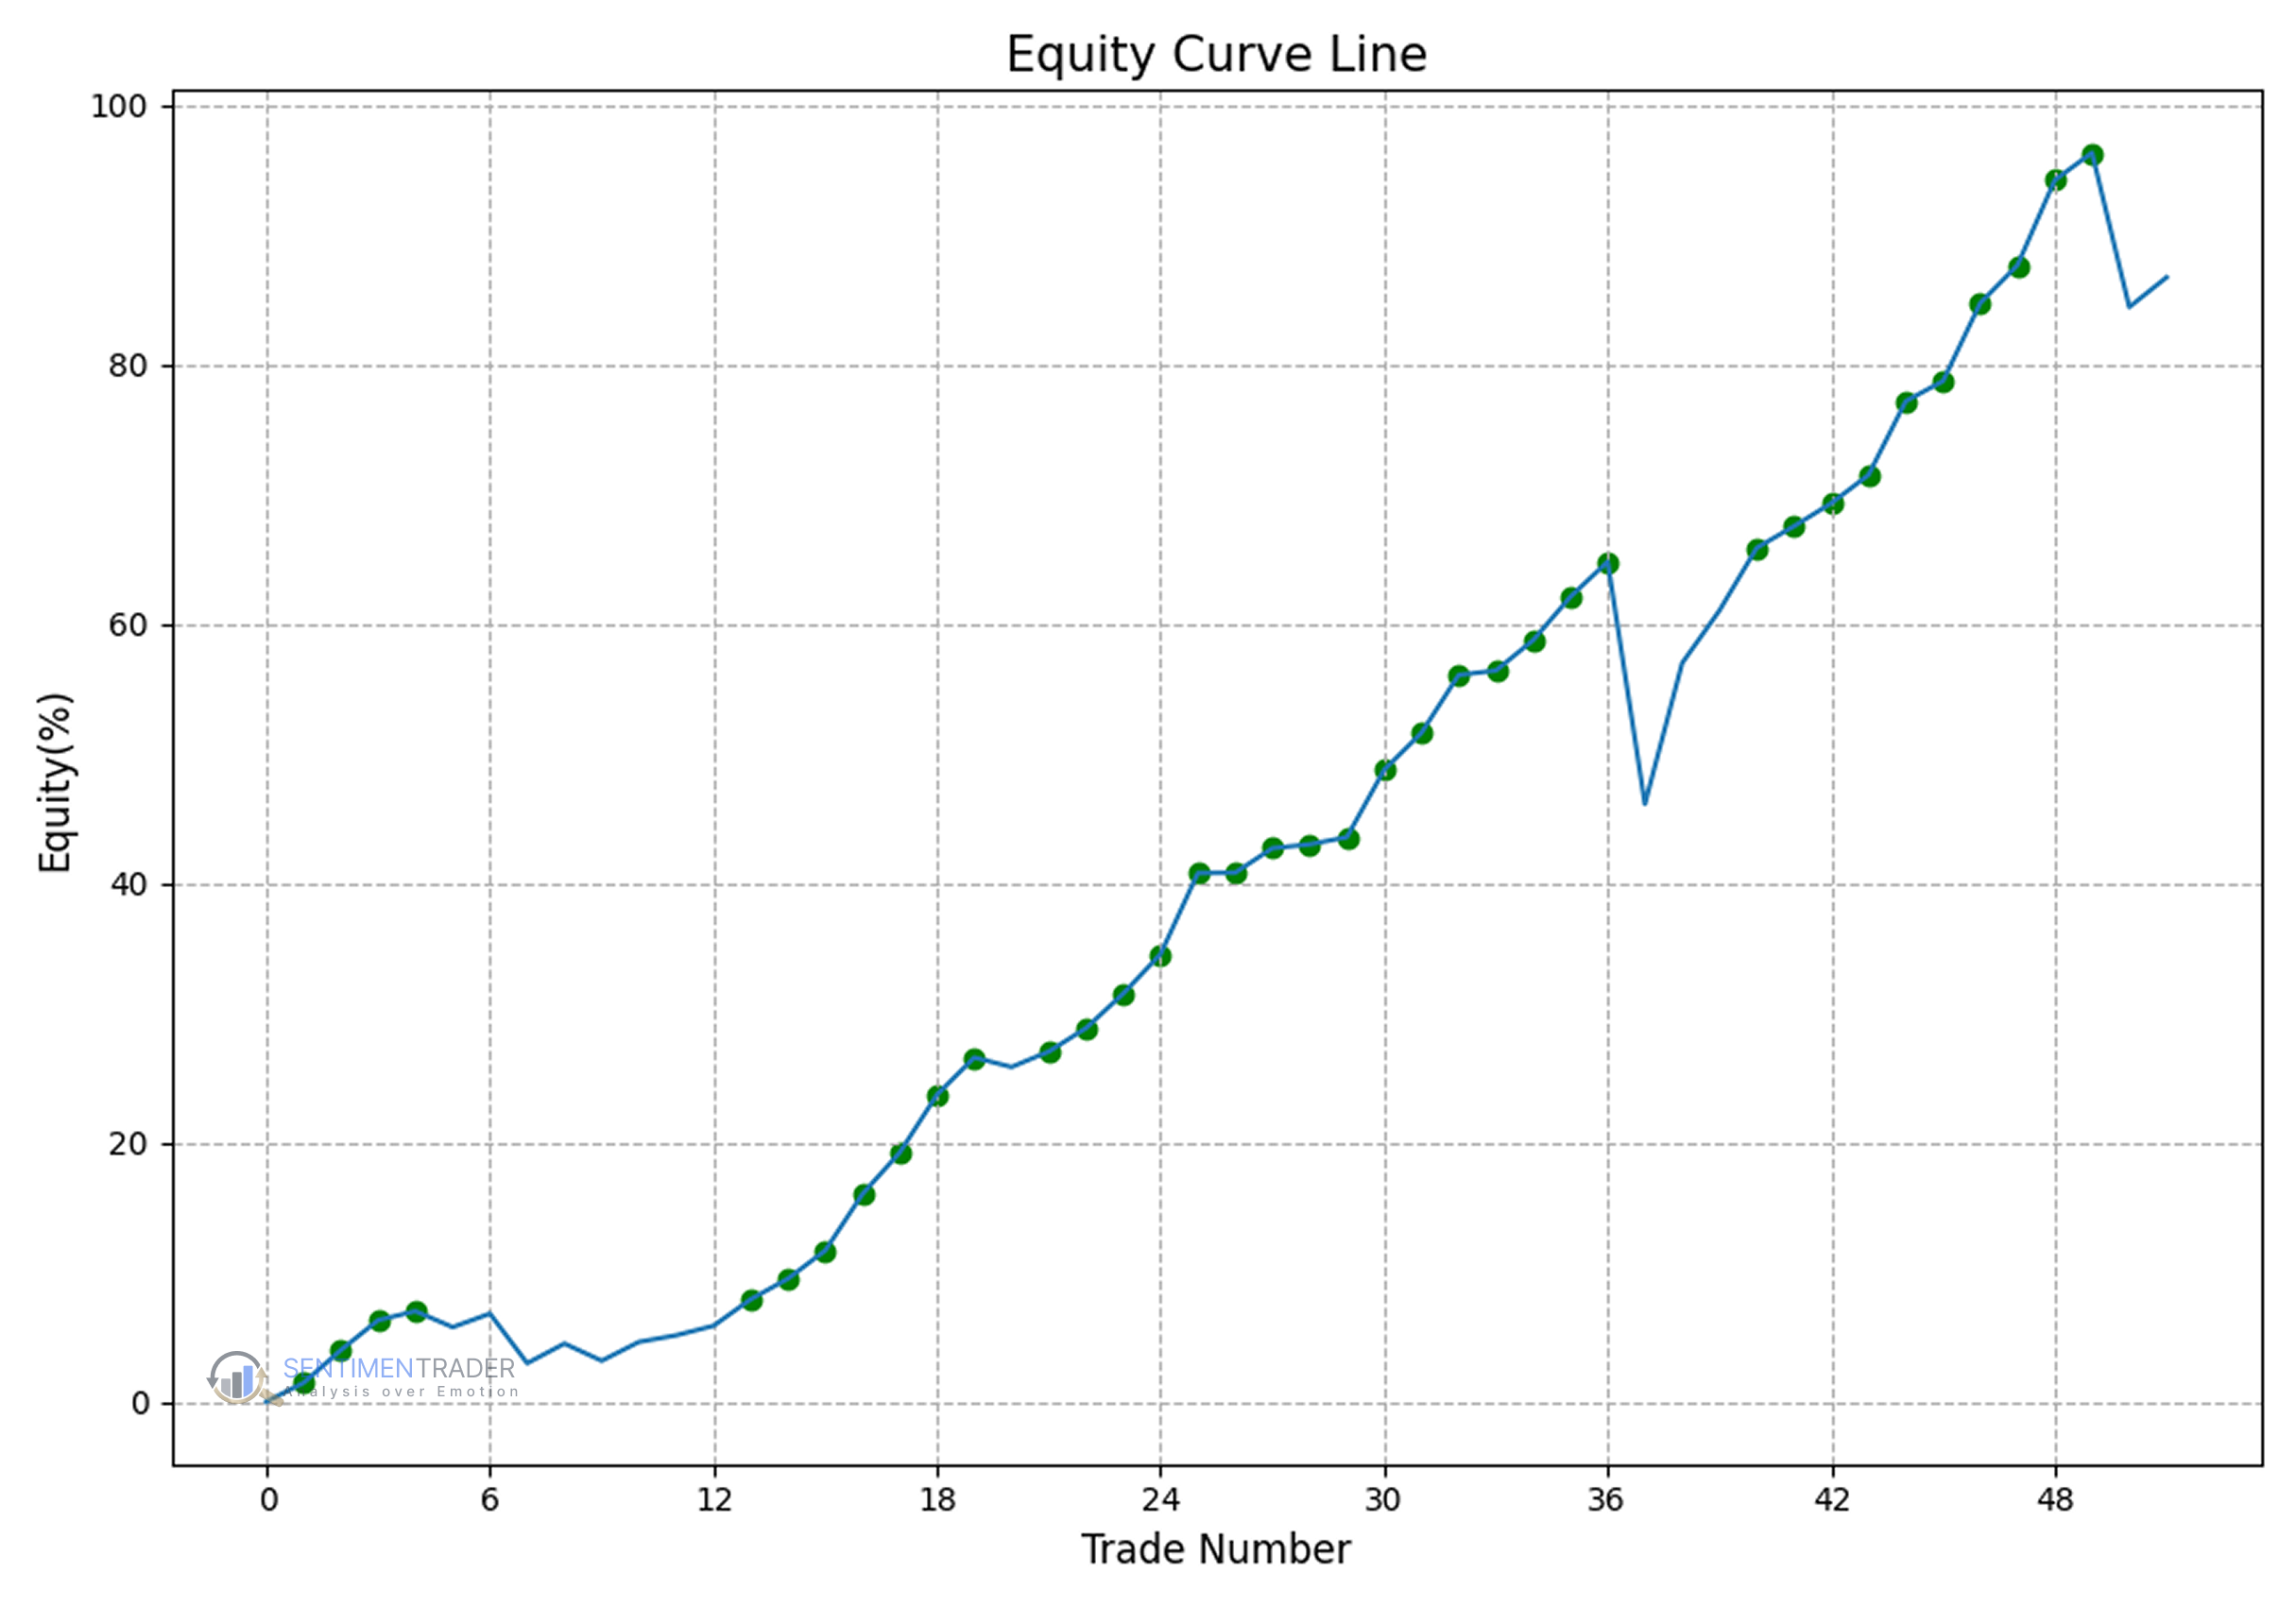
Results over 18 years:
+86.7% total return (vs. +371.5% for buy-and-hold).
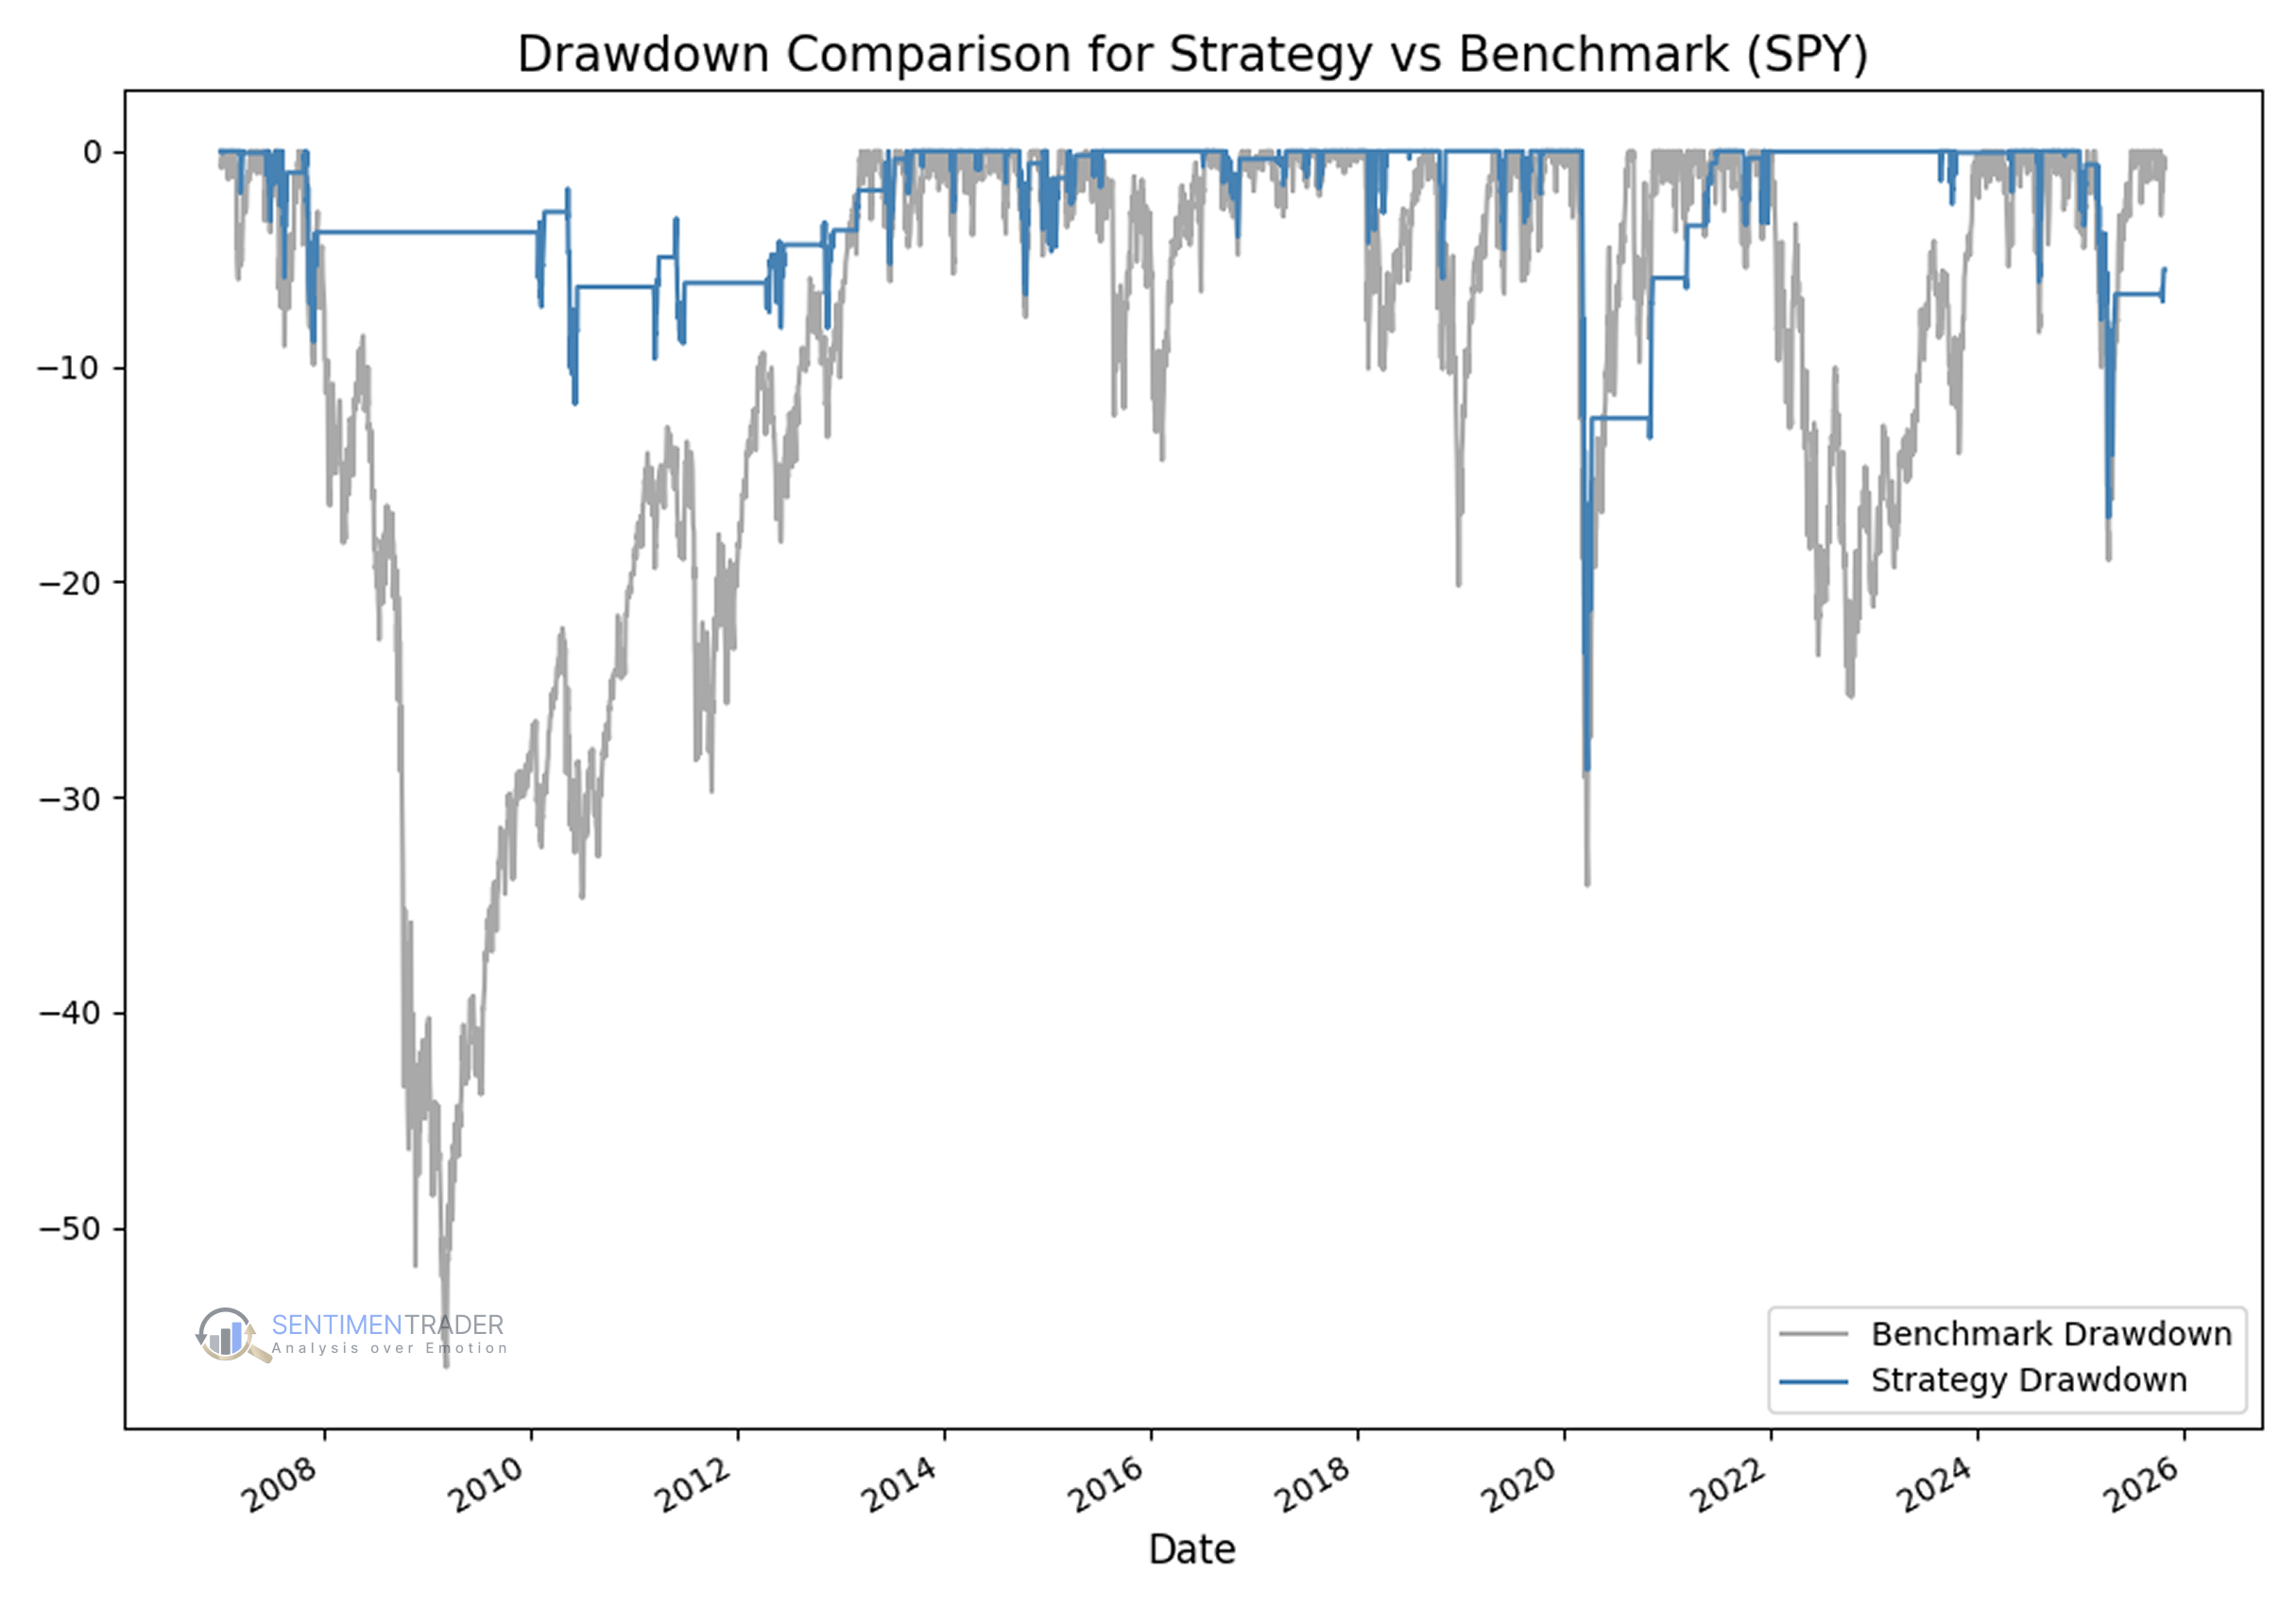
Smaller drawdowns: –28.7% vs. –50%+ during major crashes.
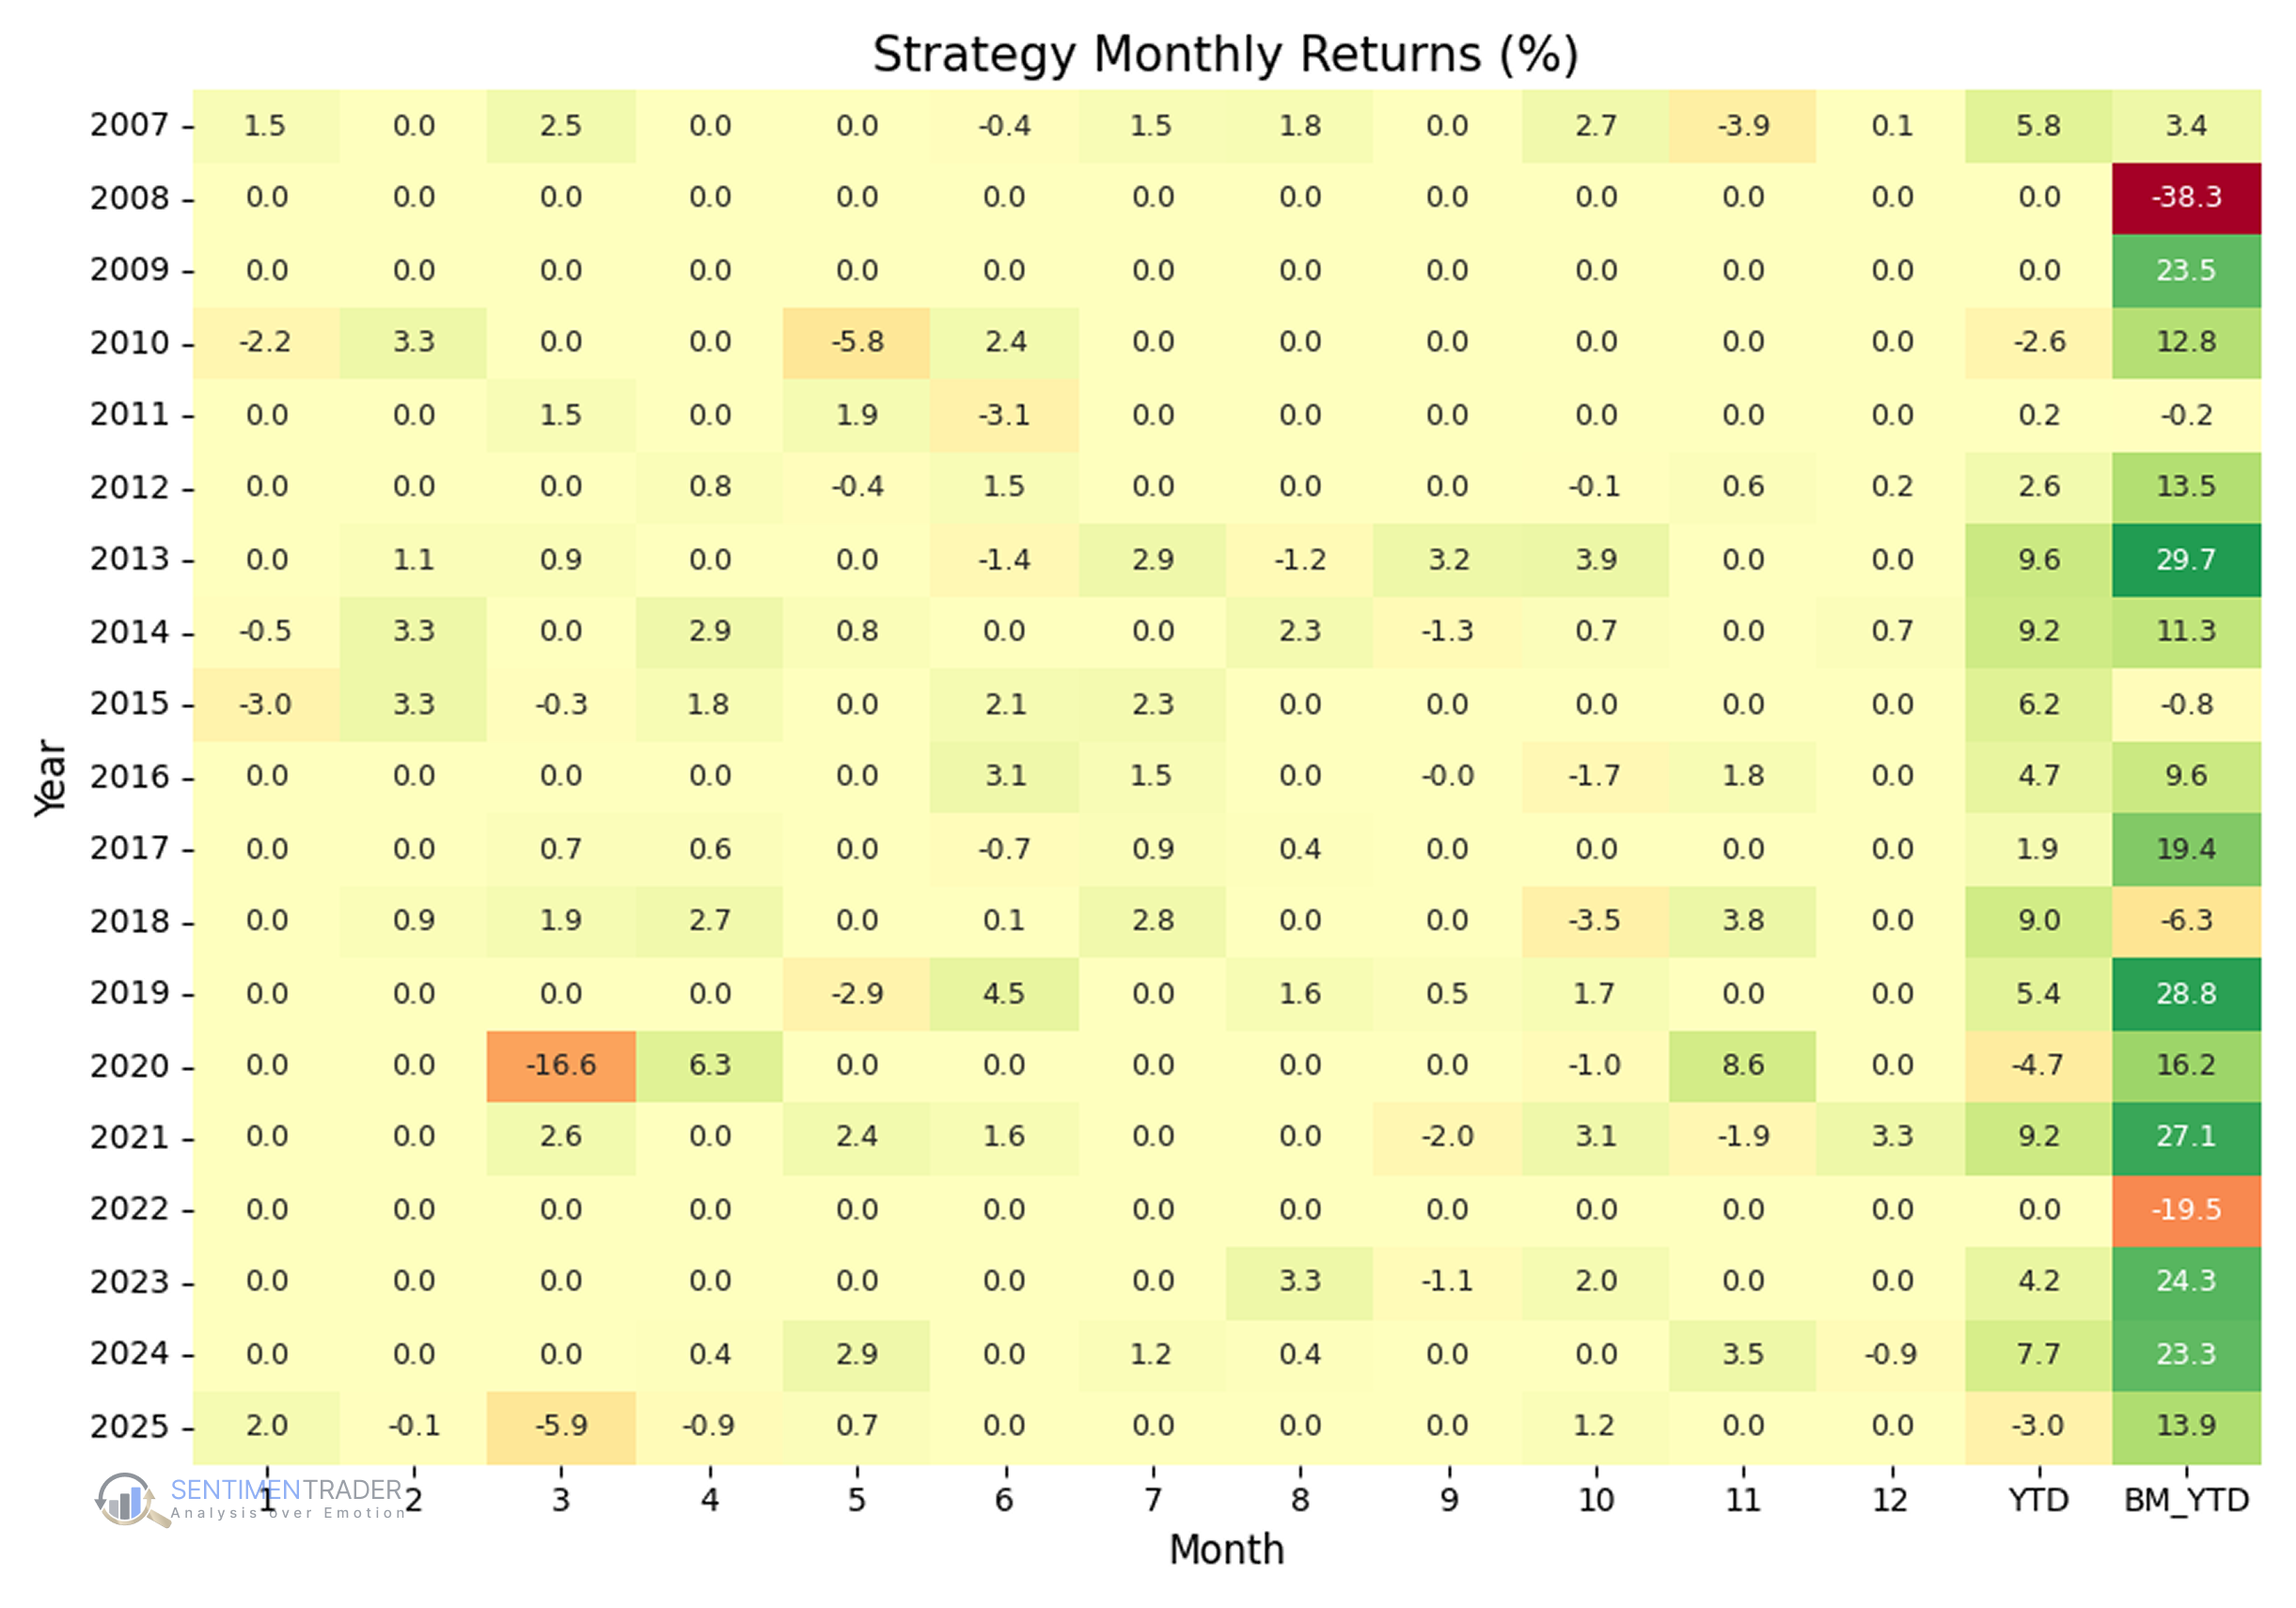
High accuracy: 88.2% win rate across 51 trades.
Steady rebound gains: Median trade +1.5%, average gain +2%.
Low exposure: In the market only 17% of the time, reducing risk but missing big rallies.
Takeaway: Even though Bollinger %b didn’t capture every major rally, it has historically helped traders pinpoint low-risk rebounds within long-term uptrends while avoiding extended downturns.
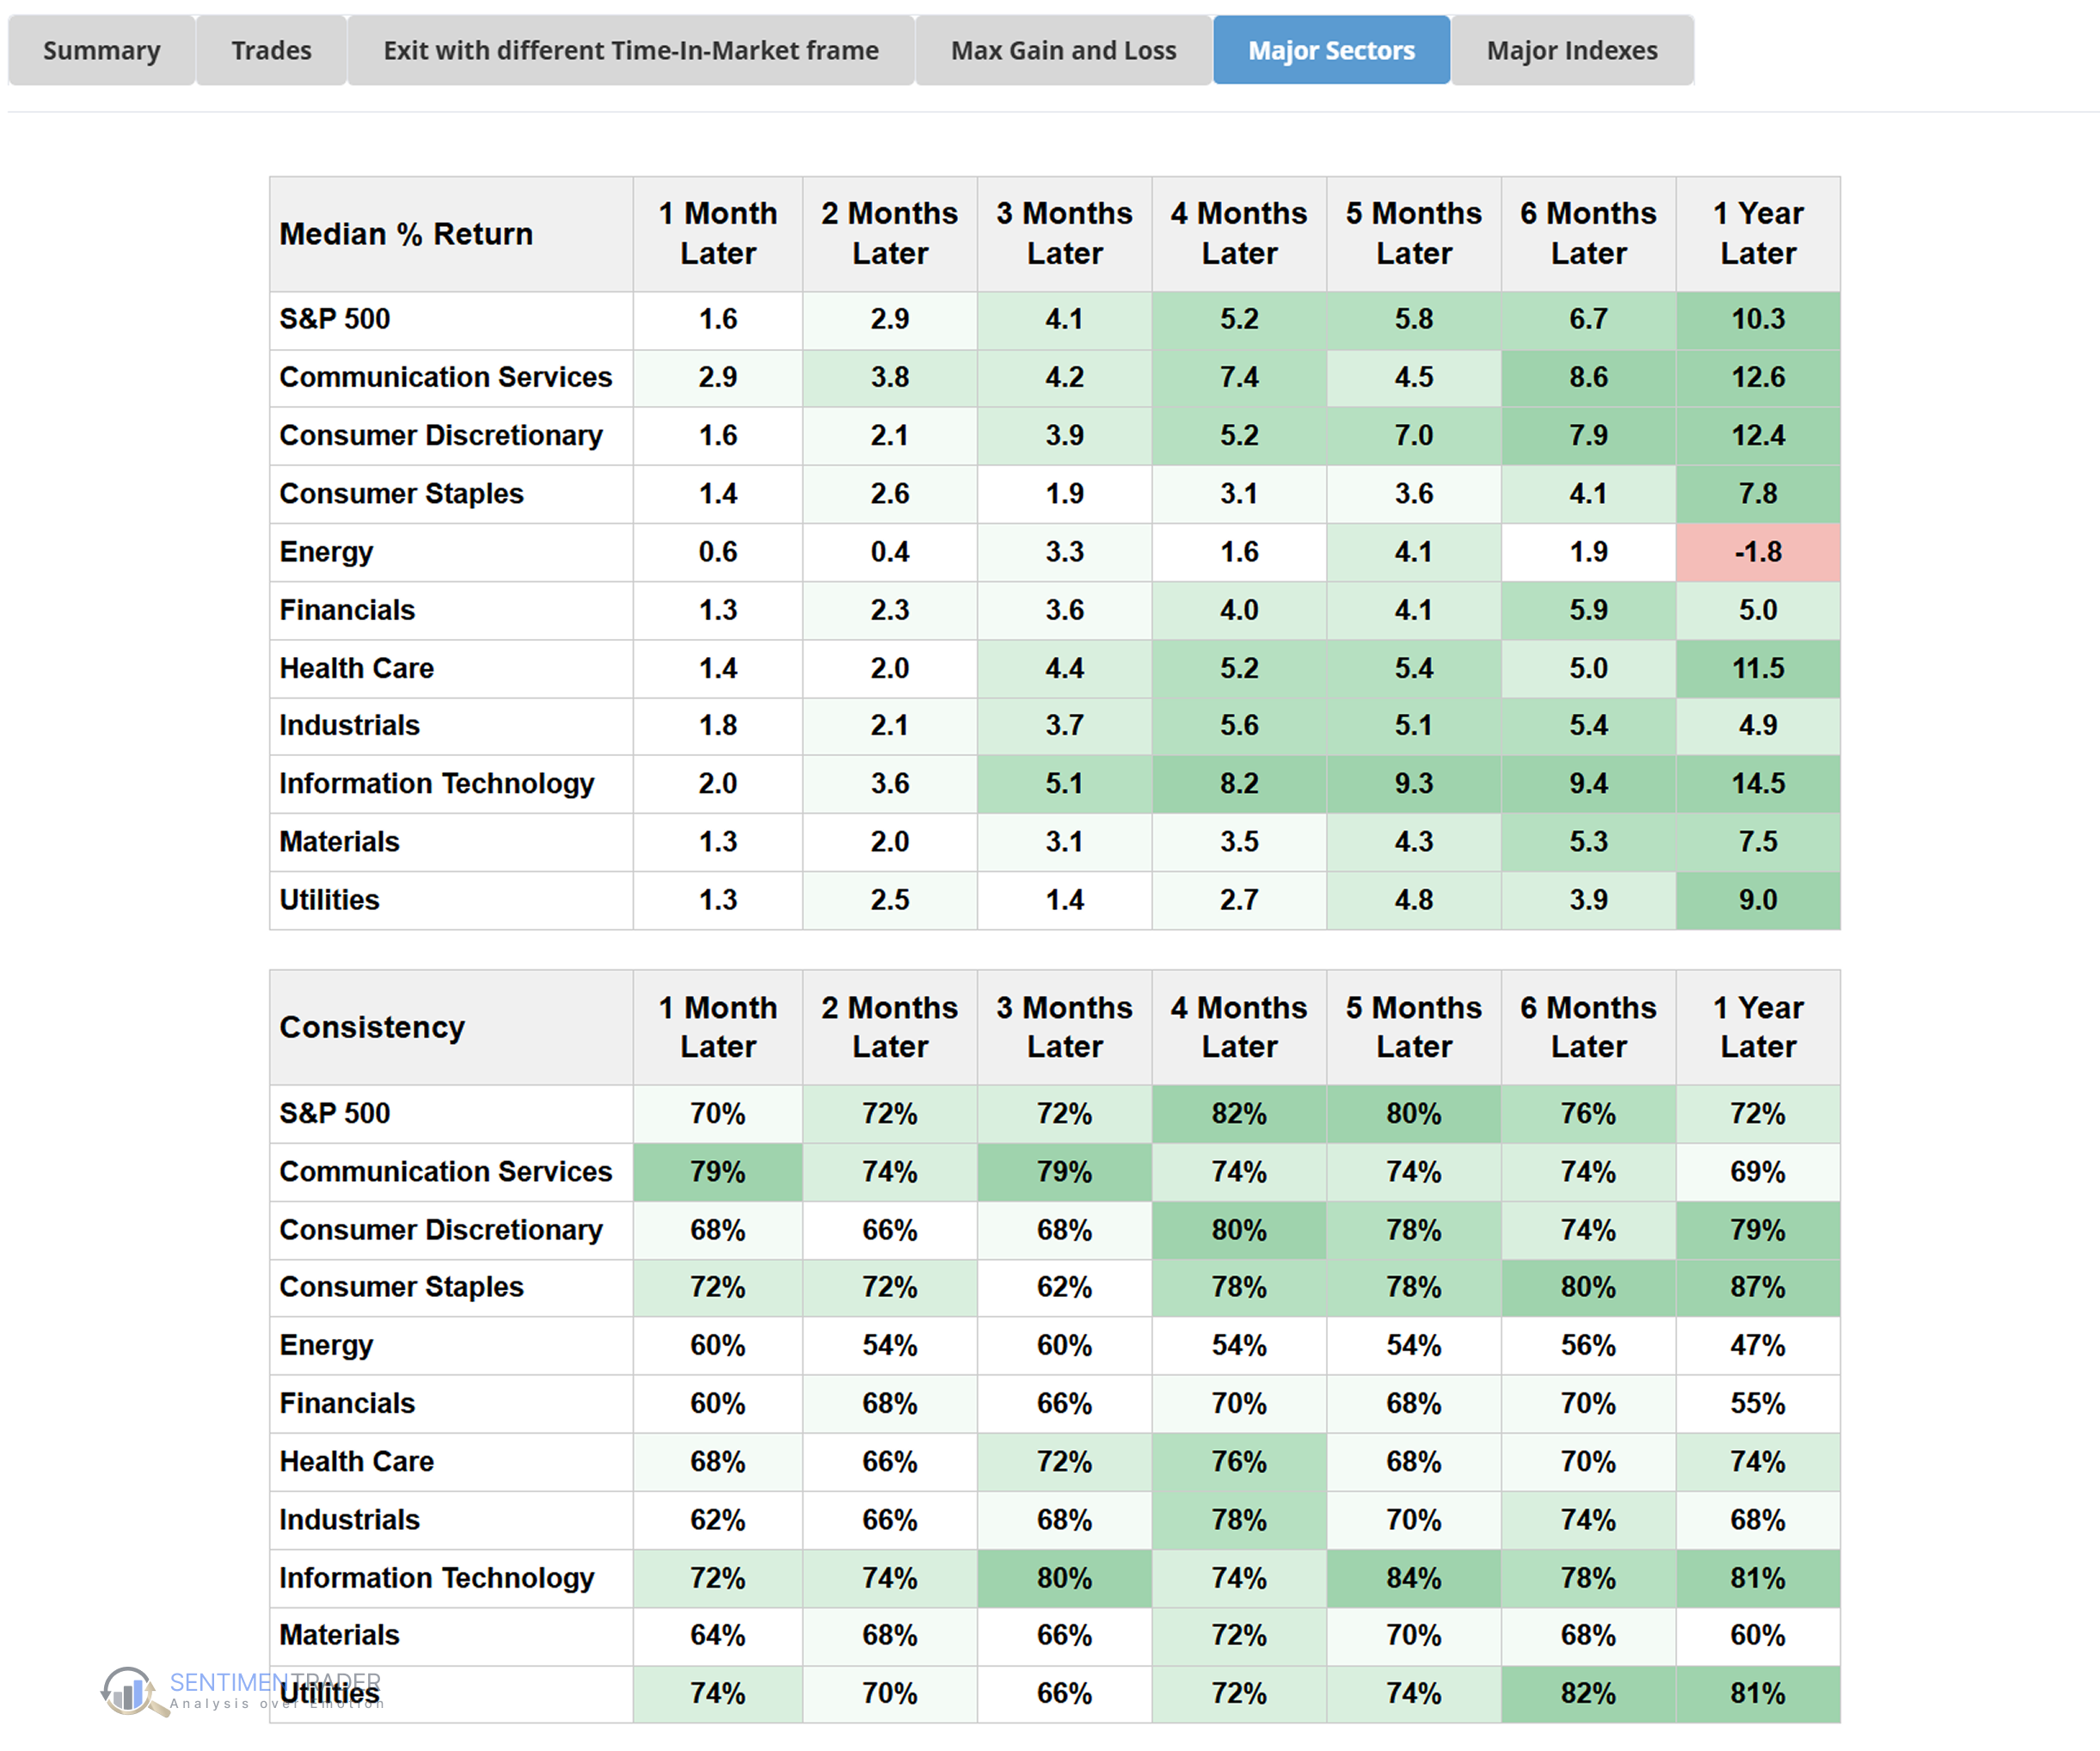
This backtest was run using SentimenTrader's Proprietary Backtest Engine, which lets you test your strategy with nearly 100 technical indicators and over 17,000 indicators covering Sentiment, Trend Score, Breadth, Macro, and Seasonality. No coding required.
What This Means for Traders
Bollinger %b doesn’t forecast direction on its own, but it makes Bollinger Band signals easier to quantify and compare. It’s especially useful for spotting when price pushes beyond normal ranges.
Still, %b can give false signals in sideways or choppy markets. That’s why traders often use it alongside indicators from other categories—for example, Moving Averages (Trend) to confirm direction, RSI (Momentum) to check strength, or On-Balance Volume (Volume) to validate participation.