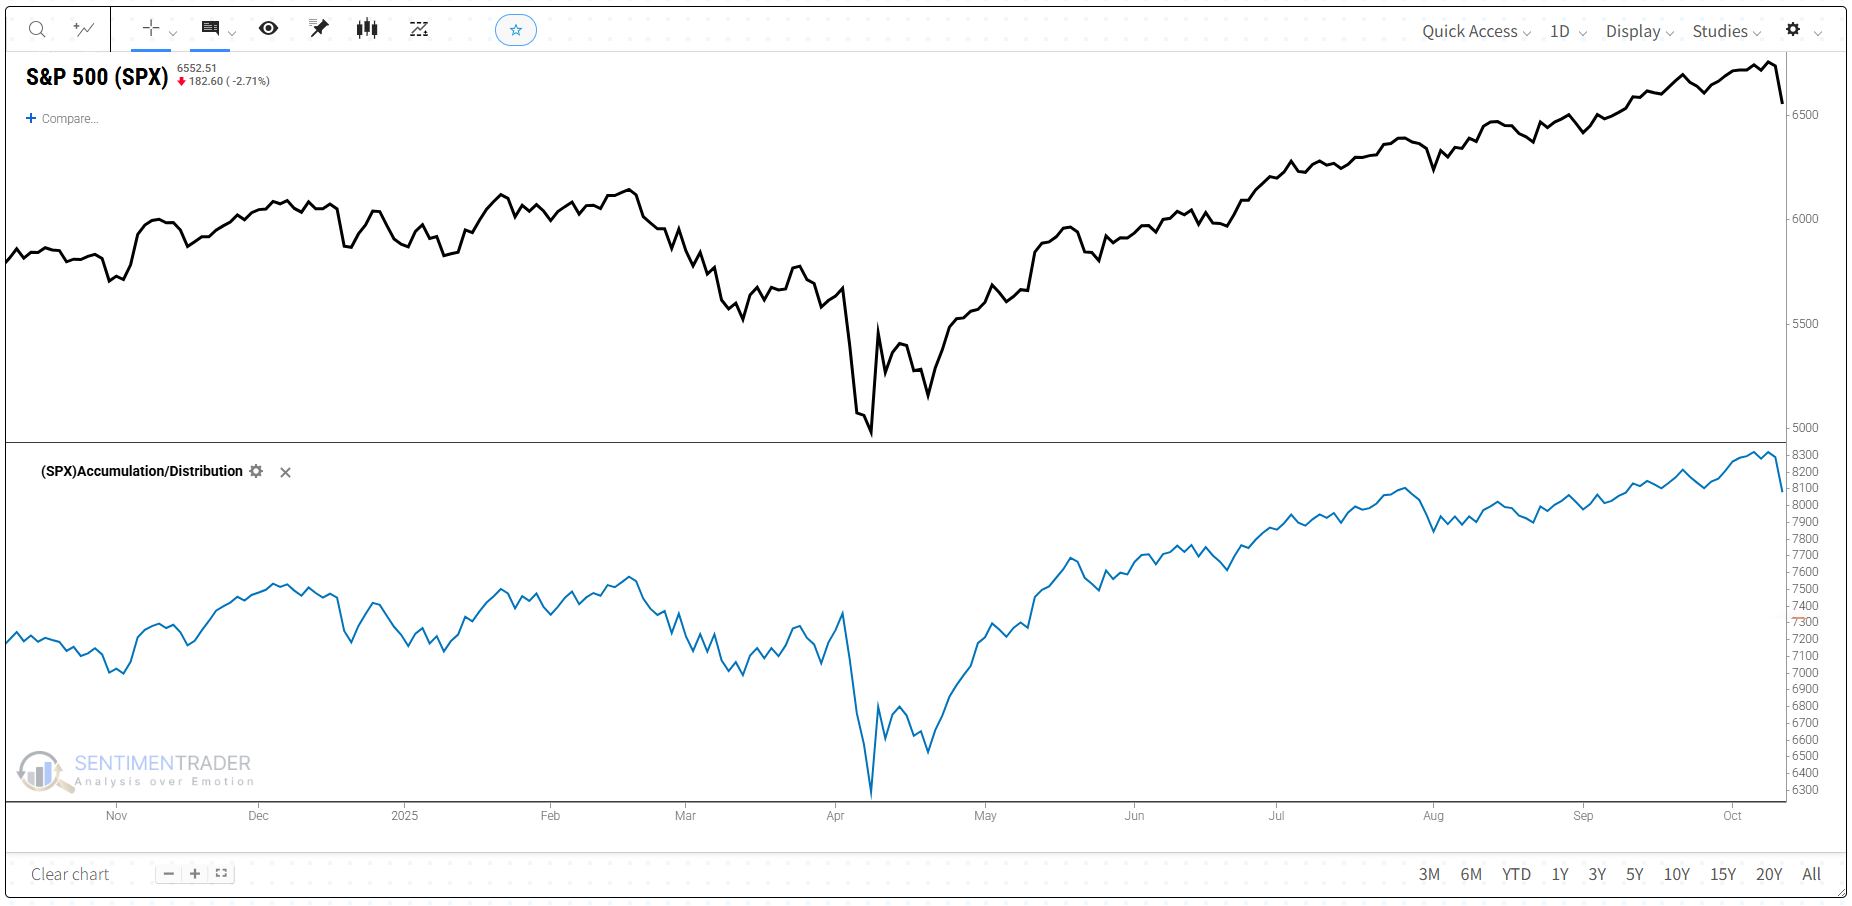
Why Accumulation/Distribution Matters
Price alone tells only part of the story — the A/D indicator adds volume context to show whether money is flowing into or out of a market. Created by Marc Chaikin, it helps traders confirm trend strength and detect early signs of change through the balance of demand and supply.
Clarity: Reveals hidden buying or selling pressure behind price moves.
Confirmation: Validates whether a price trend has strong participation.
Flexibility: Useful across timeframes and works well with other volume or momentum tools.
How Traders Use Accumulation/Distribution
Trend confirmation: When both price and A/D rise (higher highs and higher lows), buying pressure supports the uptrend. When both fall, selling pressure confirms the downtrend.
Breakouts and breakdowns: If price breaks resistance while A/D rises, it suggests the breakout has strong backing. If both drop below support, it confirms distribution.
Divergences: A positive divergence (price making new lows but A/D rising) may hint that selling pressure is fading. A negative divergence (price making new highs but A/D falling) may signal that buying enthusiasm is weakening.
Cross-asset analysis: Some traders anchor A/D to a swing high or low to see how cumulative demand changes over time.
The Technical Bit
Calculation and Components
The A/D indicator converts price–volume data into a cumulative line that rises or falls with buying and selling pressure.
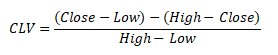
1. Calculate the Close Location Value (CLV):
Where Close = close price, High = high price, Low = low price.
CLV = +1 when price closes at the high (strong buying).
CLV = -1 when price closes at the low (strong selling).
CLV = 0 when price closes mid-range.
2. Multiply CLV by Volume to get Money Flow Volume:
3. Compute the A/D Line:
When the A/D line is rising, it indicates accumulation, meaning buying pressure is dominant.
When the A/D line is falling, it indicates distribution, meaning selling pressure is dominant.
Quick note on Volume: In trading, volume is the number of shares/contracts exchanged in a given period.
What This Means for Traders
The A/D indicator adds depth to price analysis by revealing the volume forces behind price movements. It provides a framework for discipline and confirmation, helping traders avoid chasing moves that lack real demand or supply support.
Still, A/D has limits. It ignores price gaps between periods and can lag when markets move quickly or on low volume. That’s why traders often pair it with indicators from other categories — for example, Moving Averages (Trend) to define direction, MACD (Momentum) to gauge acceleration, or Bollinger Bands (Volatility) to see if a move is stretching beyond normal ranges.
Combining these tools helps distinguish routine price swings from true accumulation or distribution events driven by meaningful participation.