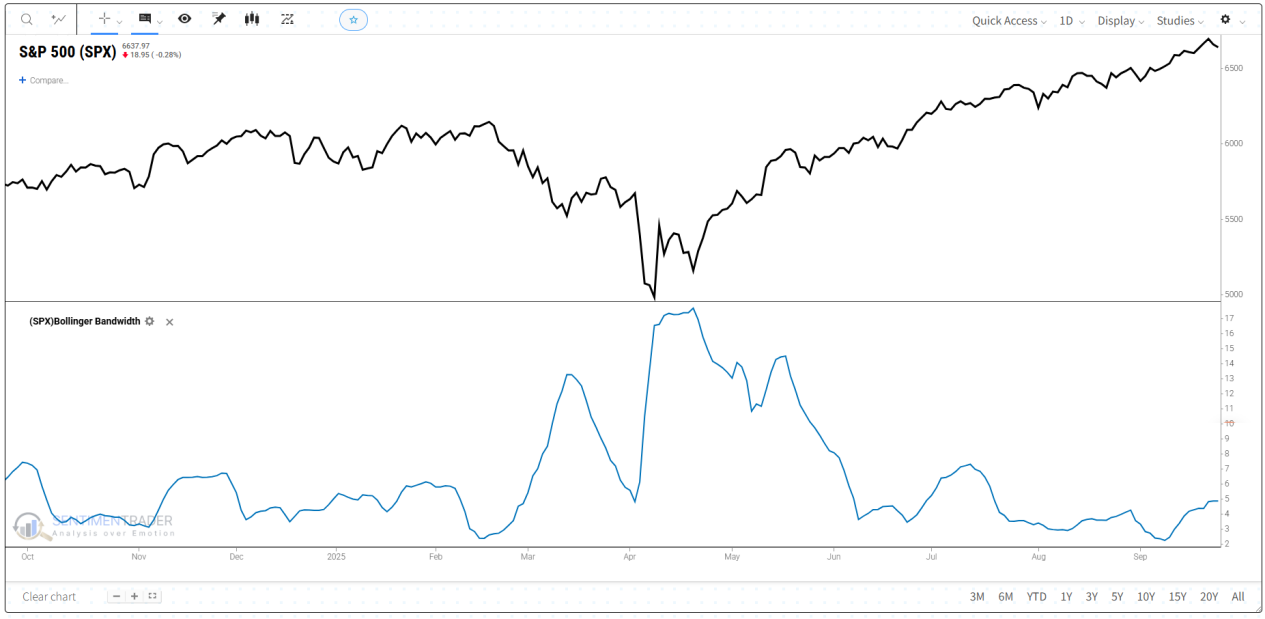
Why Bollinger Bandwidth Matters
Markets shift between quiet consolidation and explosive movement. Bollinger Bandwidth highlights these transitions by turning the width of Bollinger Bands into a single line, making volatility easier to track.
Clarity: Transforms complex price action into a simple measure of volatility.
Flexibility: Works across different timeframes and assets, from intraday to long-term.
Volatility Insight: Pinpoints when conditions are unusually calm or unusually active.
How Traders Use Bollinger Bandwidth
Spotting squeezes: Very low Bandwidth often signals consolidation, hinting that a breakout move may follow.
Tracking volatility cycles: Expanding Bandwidth shows volatility rising, while contracting Bandwidth shows volatility fading.
Trend exhaustion: Extremely wide Bandwidth can signal a trend is overextended and may be slowing.
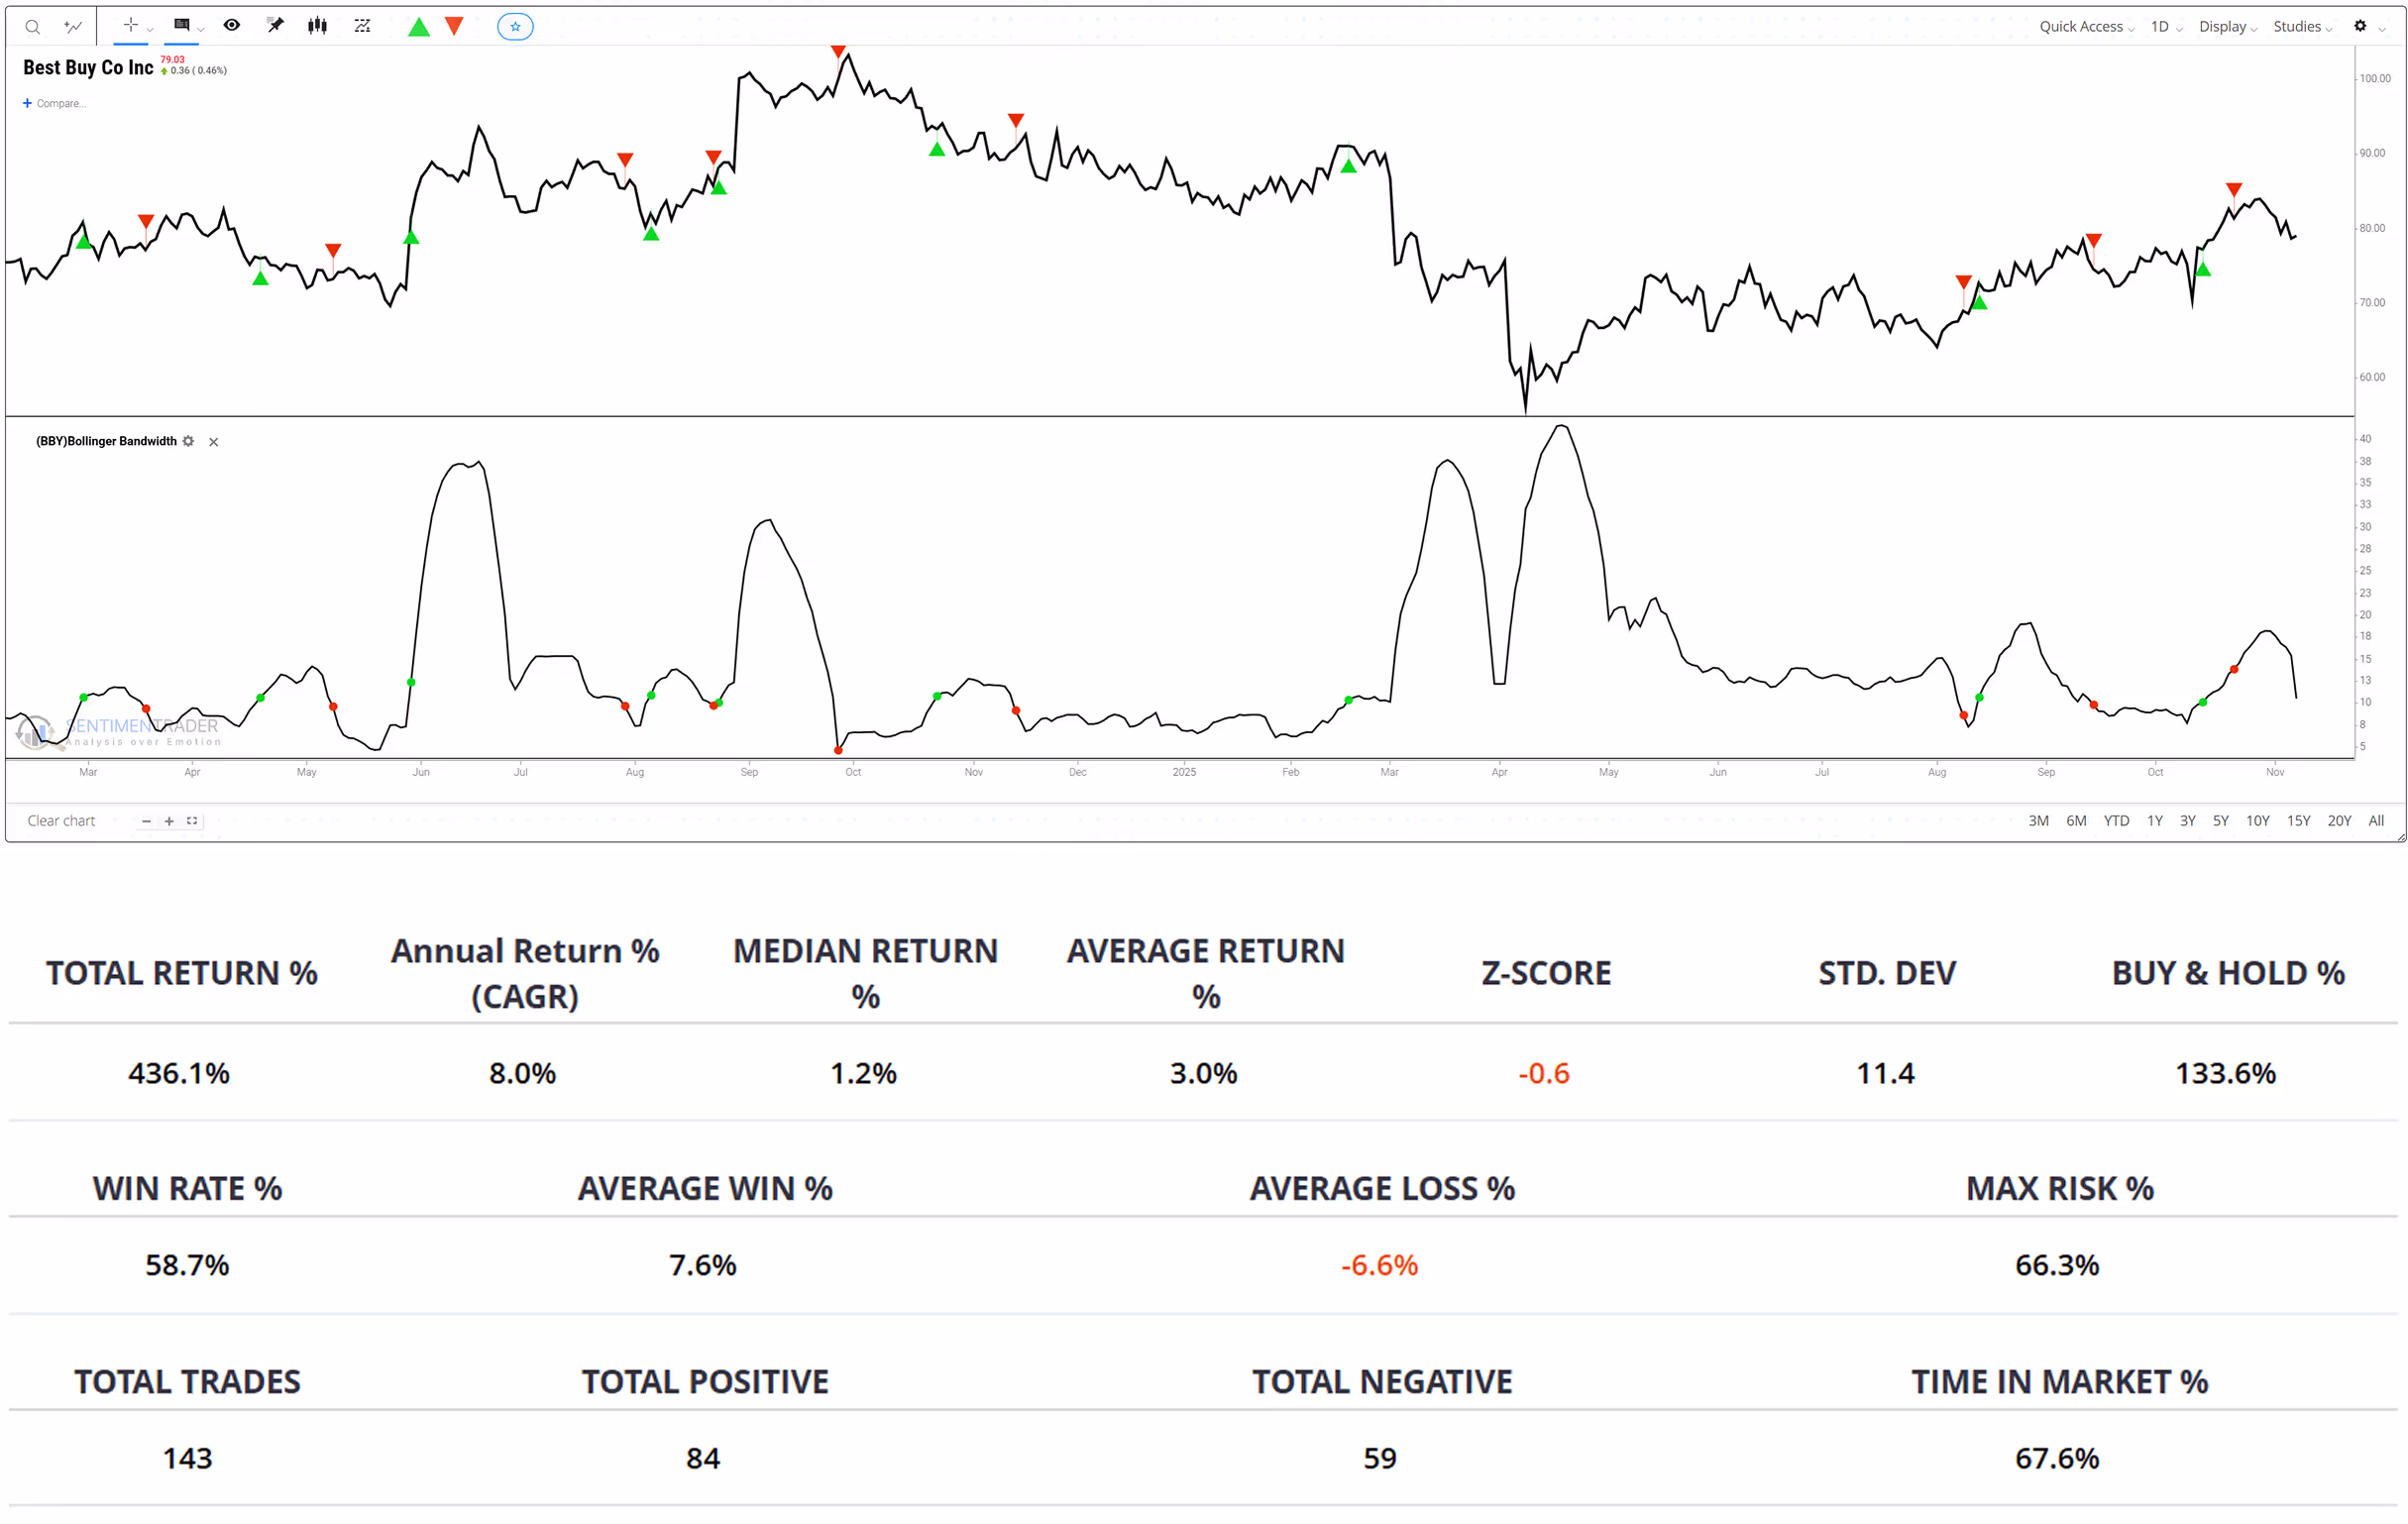
Real-World Results: Do They Actually Work?
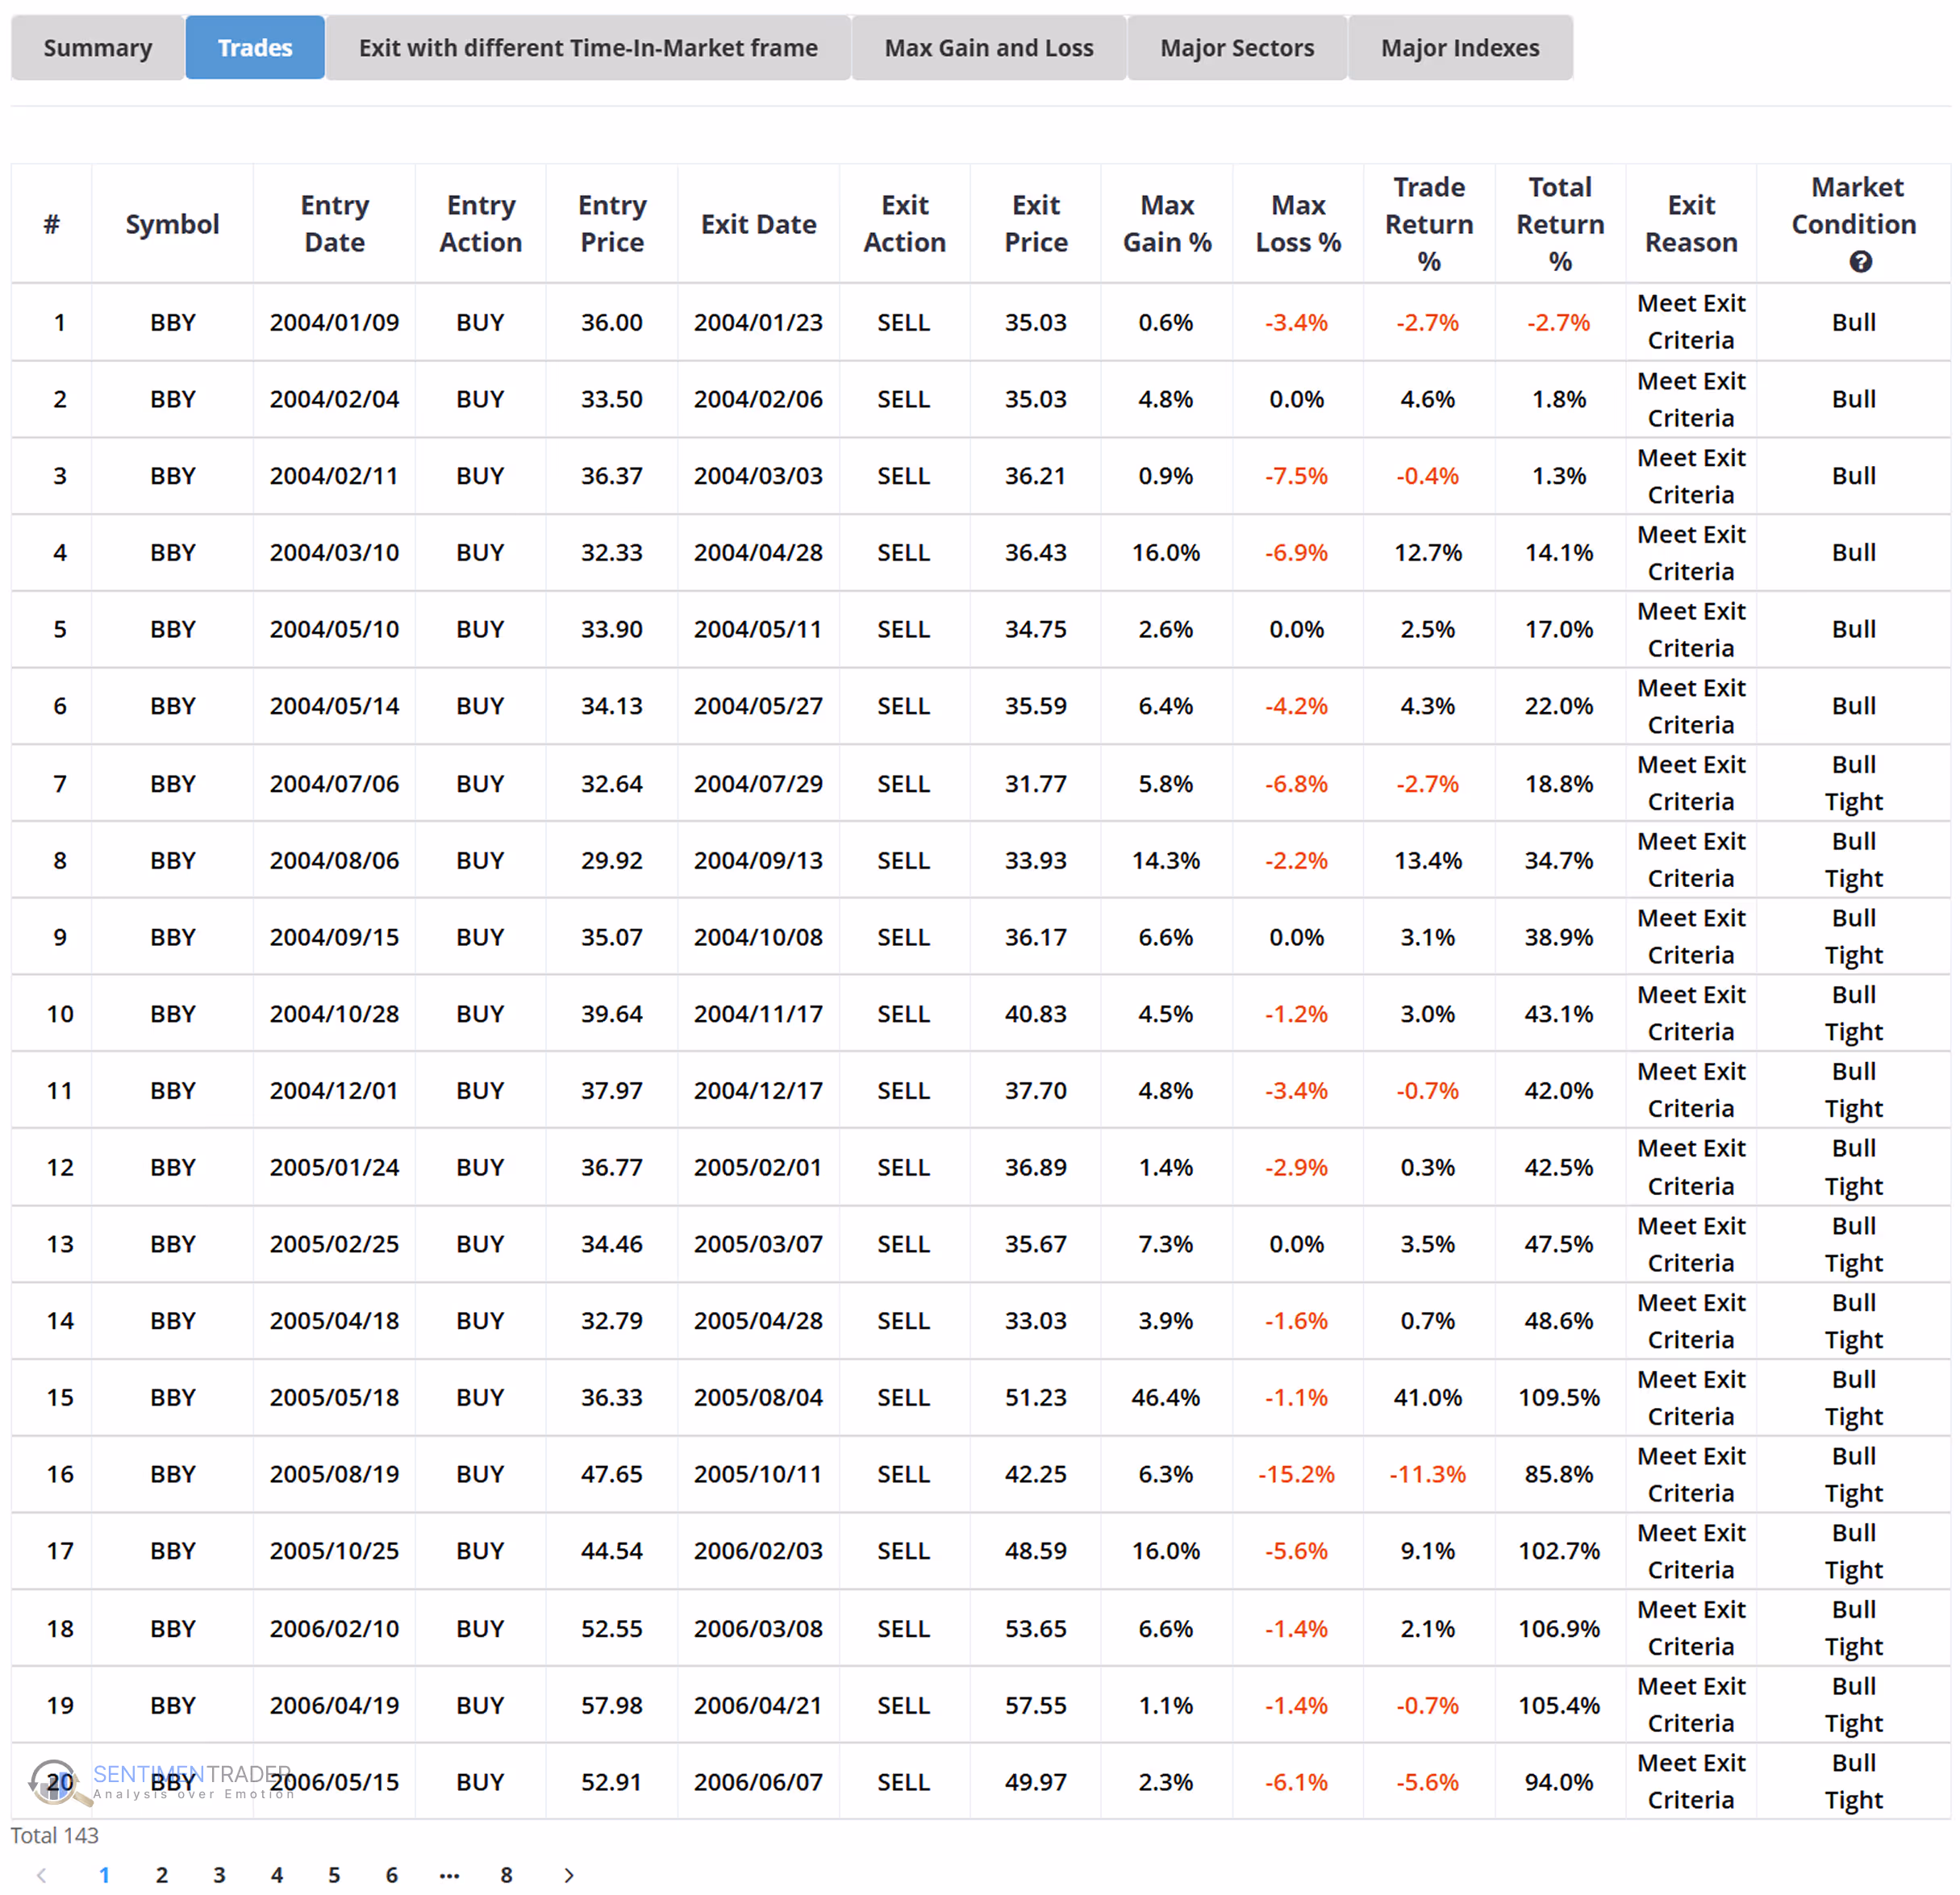
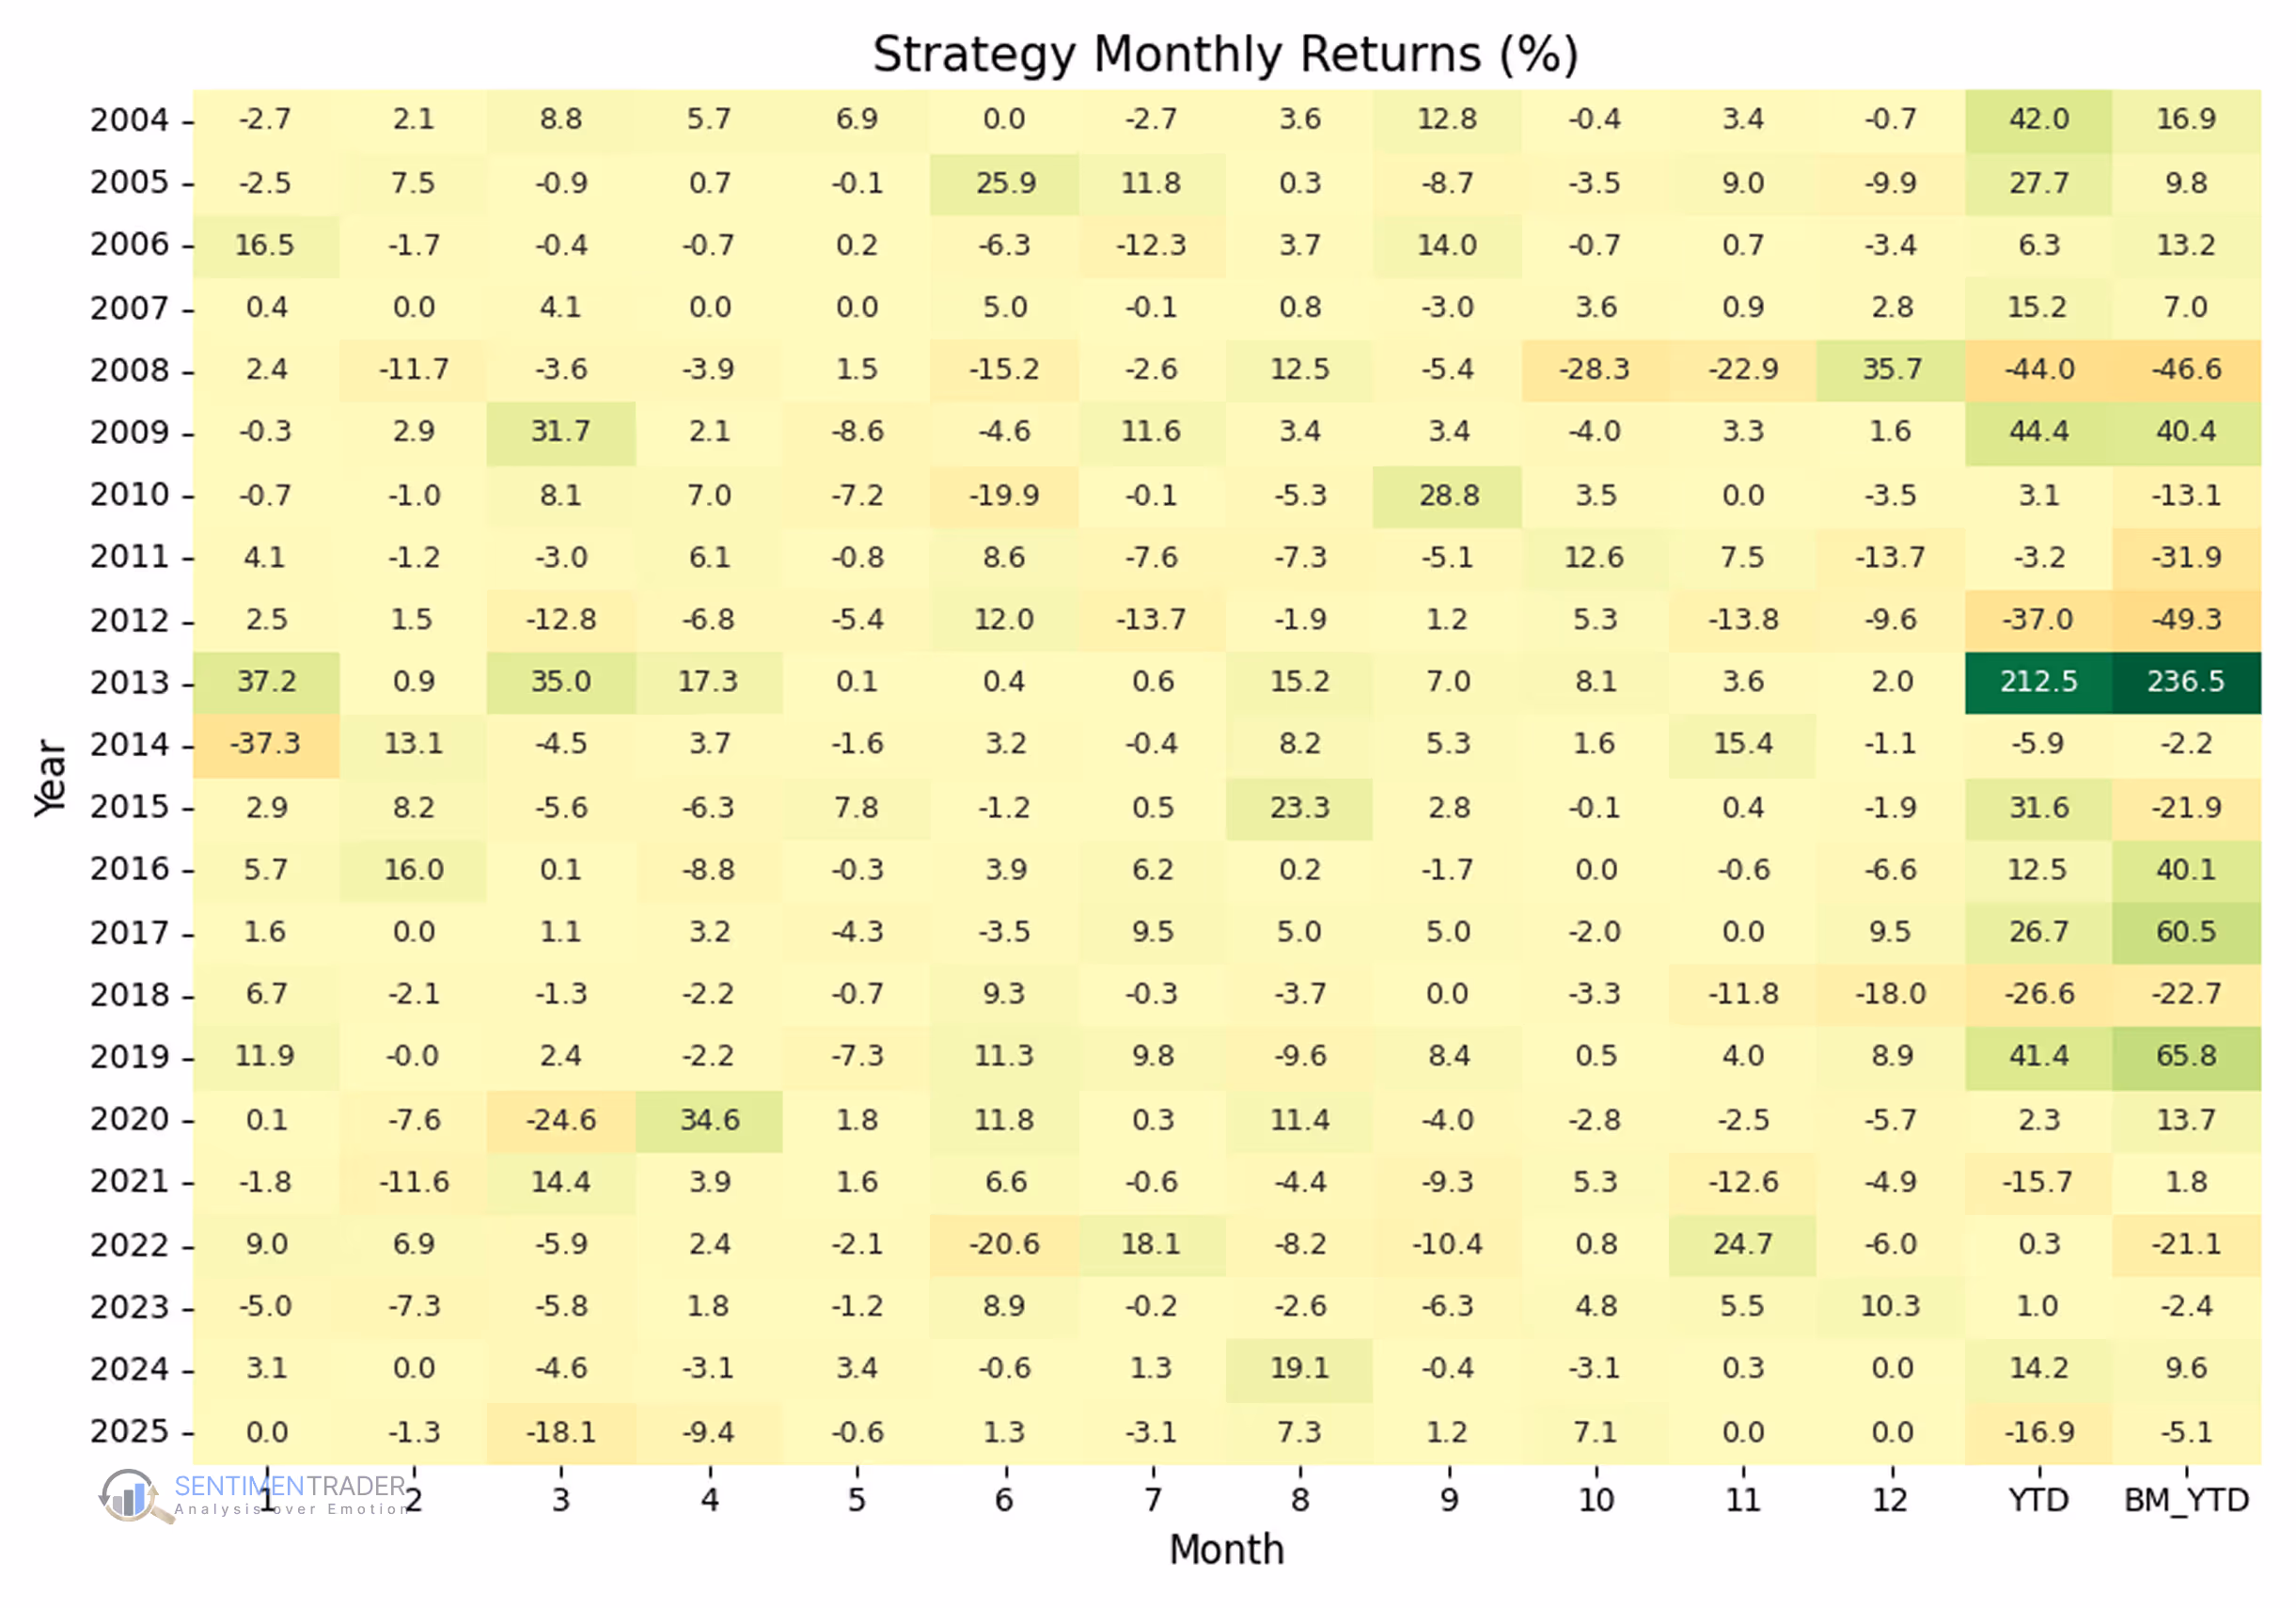
To test how well Bollinger Bandwidth identifies volatility shifts, we ran a backtest on Best Buy Co. (BBY) from 2004 to 2025 using a simple rule:
Buy: When Bollinger Bandwidth crosses above 10, signaling a volatility expansion.
Sell: When it crosses back below 10, indicating contraction.
Results over 21 years:
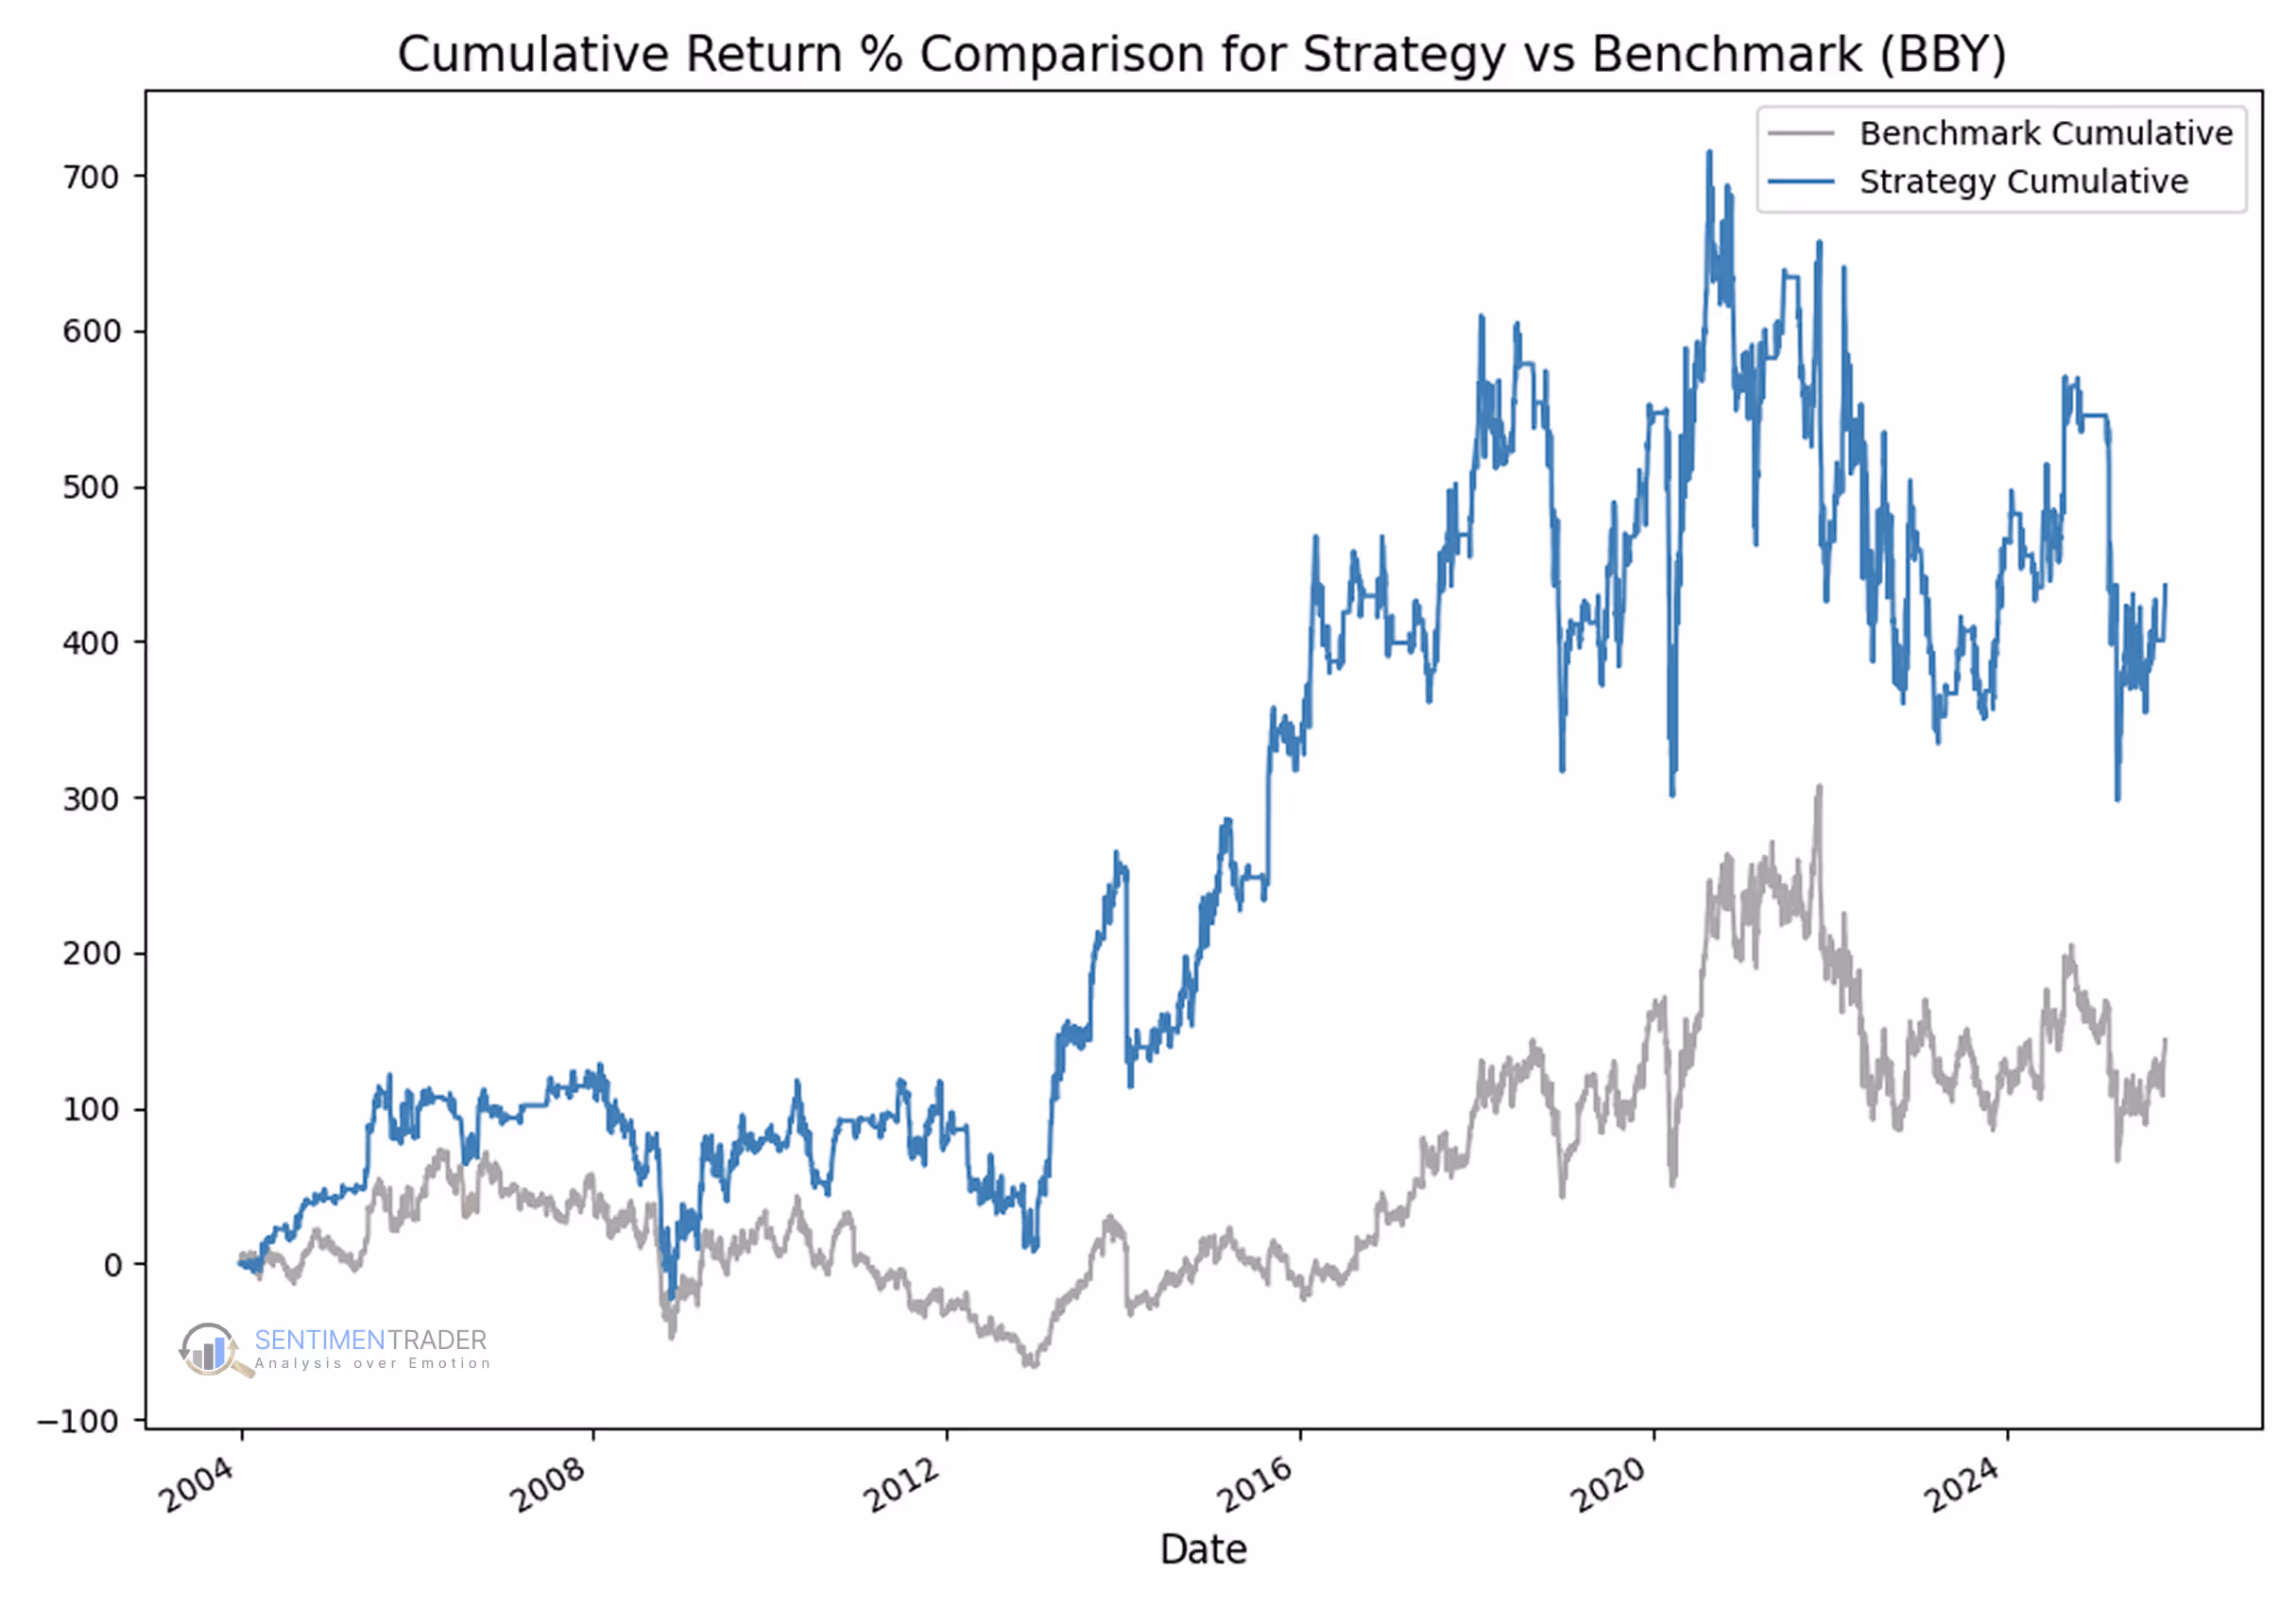
+436 % total return (vs. +134 % for buy-and-hold).
Annualized return: 8.0 %.
Smaller drawdowns: –66 % vs. –80 % for BBY in major crashes.
Median return: +1.2 %, showing occasional large winners amid many small moves.
Takeaway: Even though Bollinger Bandwidth doesn’t predict which way price will move, it has historically helped traders recognize when volatility was about to expand—an edge useful for timing entries, exits, or risk adjustments during changing market conditions.
This backtest was run using SentimenTrader's Proprietary Backtest Engine, which lets you test your strategy with nearly 100 technical indicators and over 17,000 indicators covering Sentiment, Trend Score, Breadth, Macro, and Seasonality. No coding required.
What This Means for Traders
Bollinger Bandwidth shows when the market is unusually quiet or unusually active. This helps traders prepare for potential breakouts after low-volatility periods or exercise caution when volatility spikes.
Because Bandwidth only measures volatility, traders often pair it with tools from other categories for context—for example, Moving Averages (Trend) to confirm direction, RSI (Momentum) to gauge strength during breakouts, and On-Balance Volume (Volume) to check whether participation supports the move.
Using Bandwidth alongside these indicators provides a more complete view of both volatility and overall market behavior.