Why MACD Matter
Markets aren’t just about direction—they speed up, slow down, and sometimes reverse. The MACD was designed to capture these changes in momentum by comparing short- and long-term moving averages.
This is why it remains one of the most popular momentum indicators in technical analysis:
Clarity: Condenses trend and momentum into a single chart, making shifts easier to spot.
Simplicity: Three components—the MACD line, Signal line, and Histogram—offer a complete picture without overcomplication.
Momentum insight: Goes beyond trend direction to reveal when a move is strengthening, weakening, or diverging from price action.
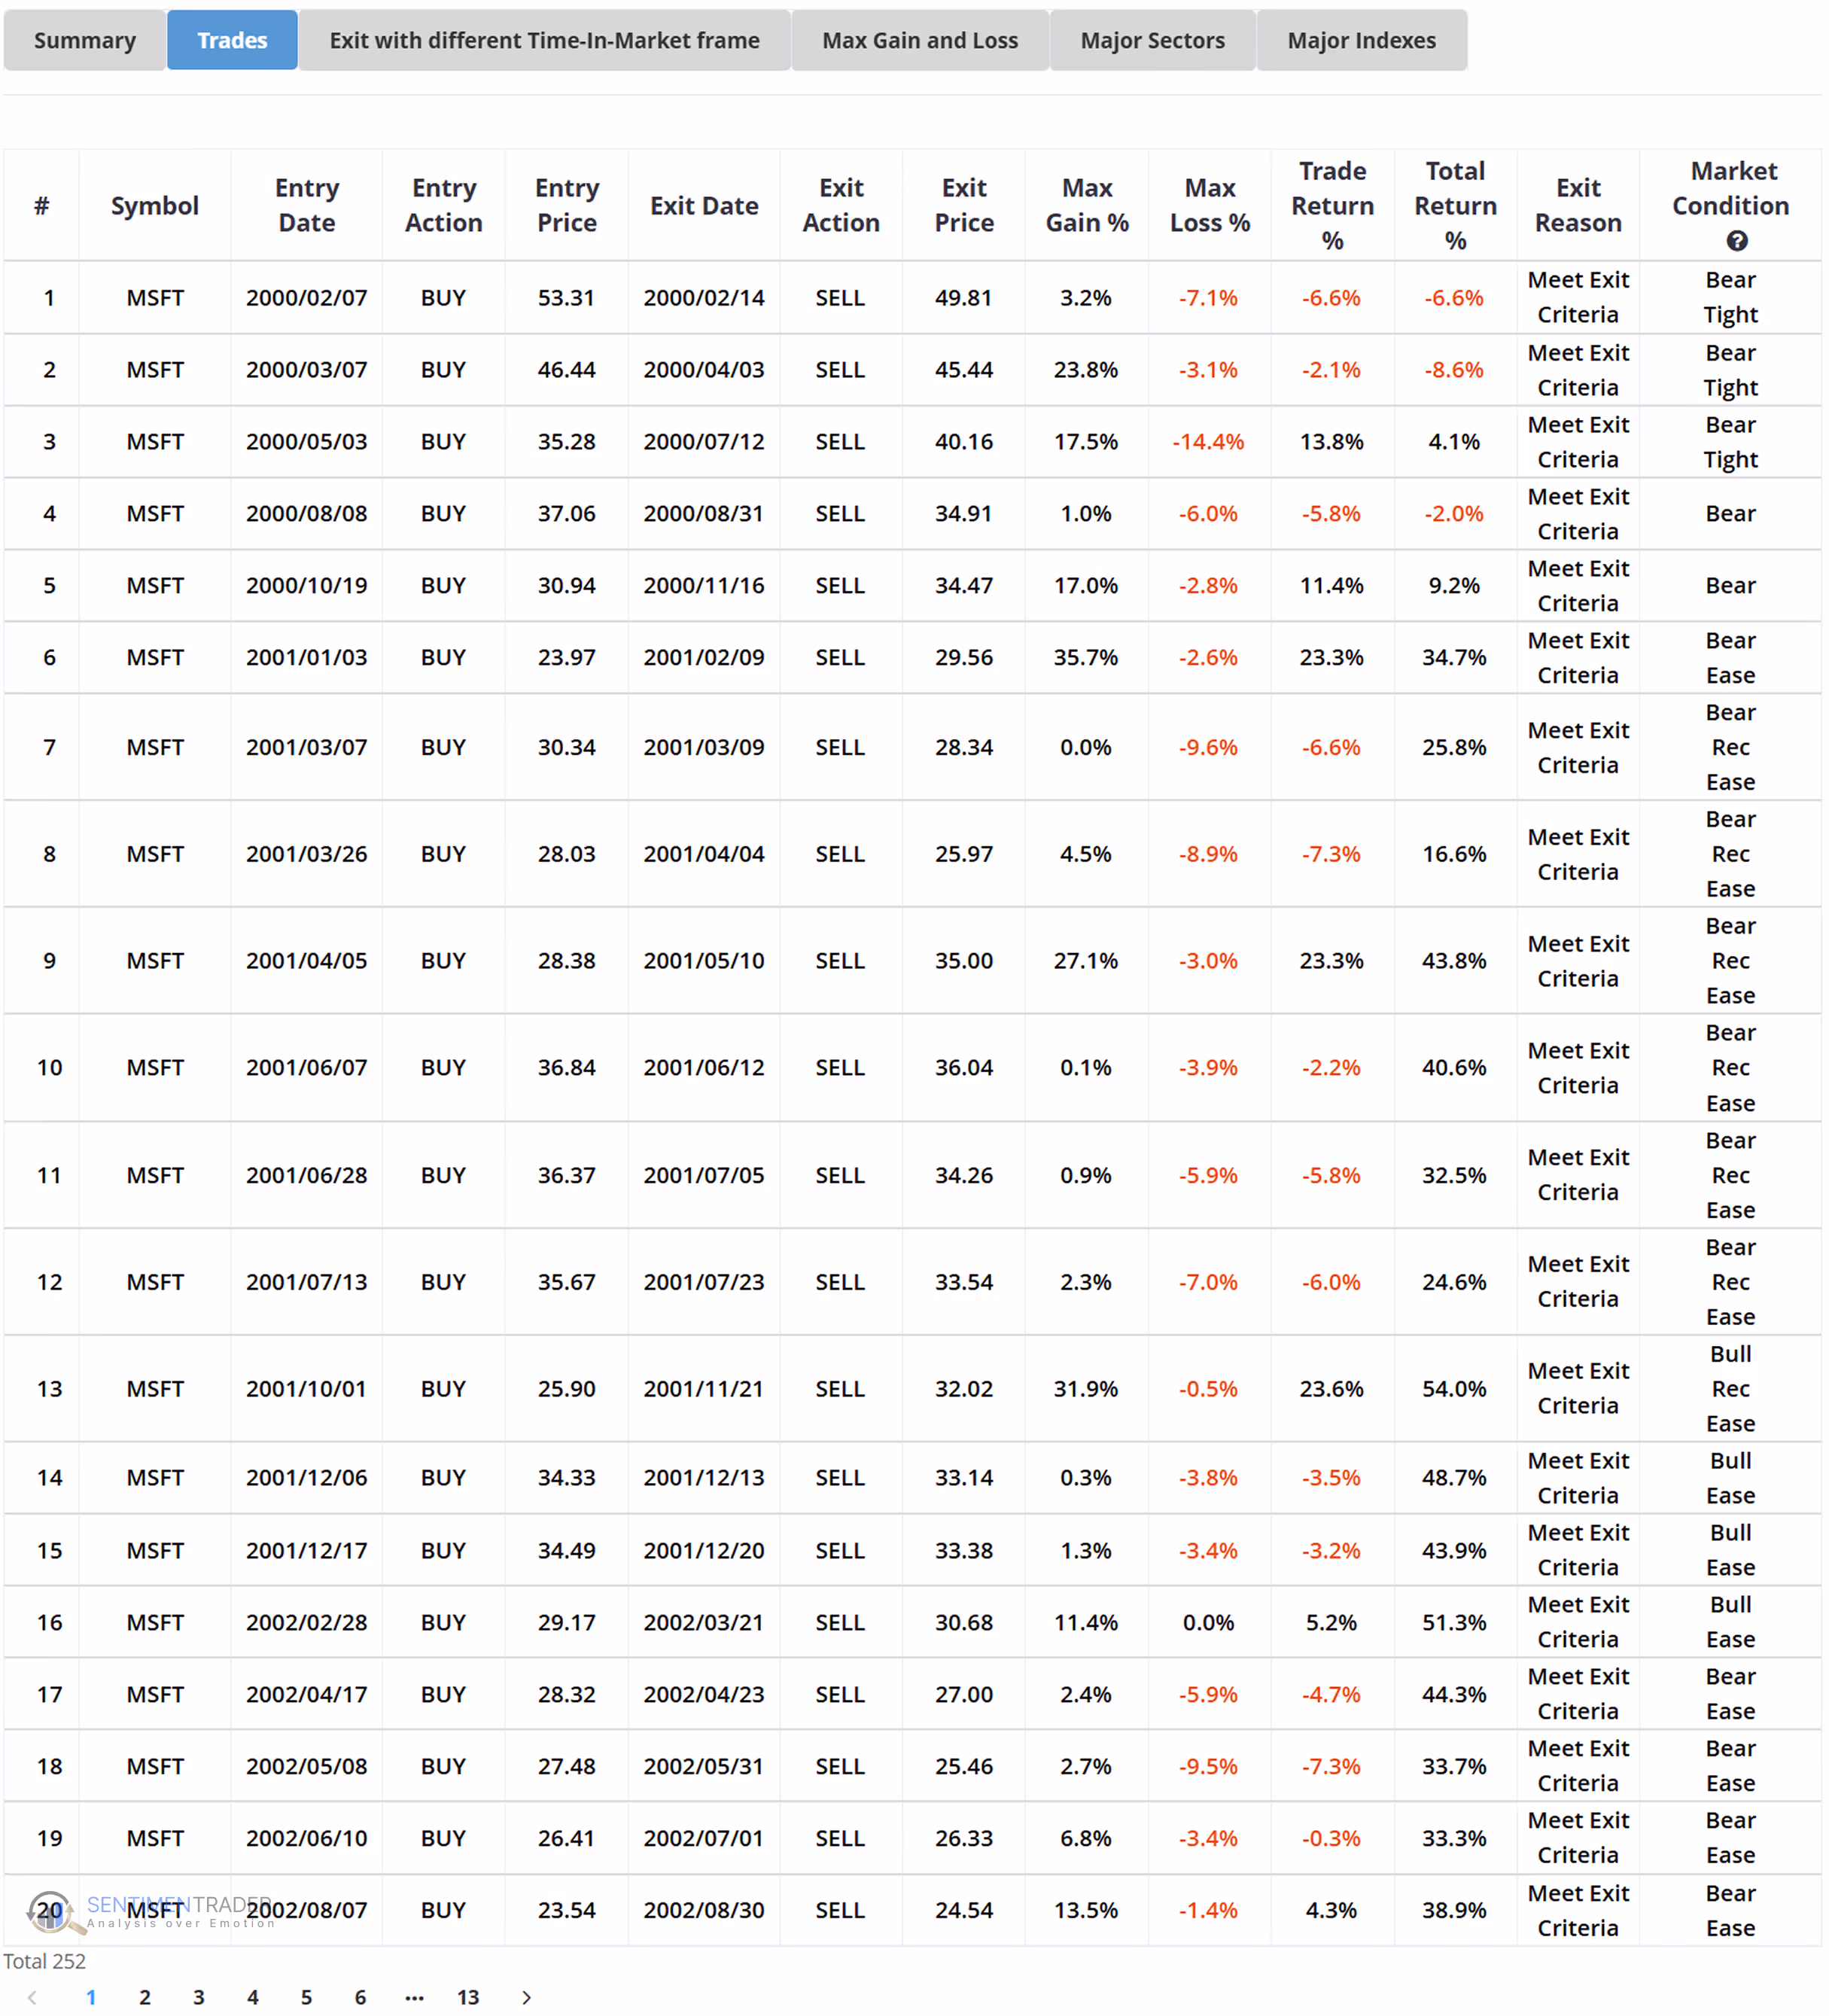
Real-World Results: Do They Actually Work?
To test how well MACD captures momentum shifts in practice, we ran a backtest on Microsoft (MSFT) from 2000 to 2025 using a simple signal-line crossover strategy:
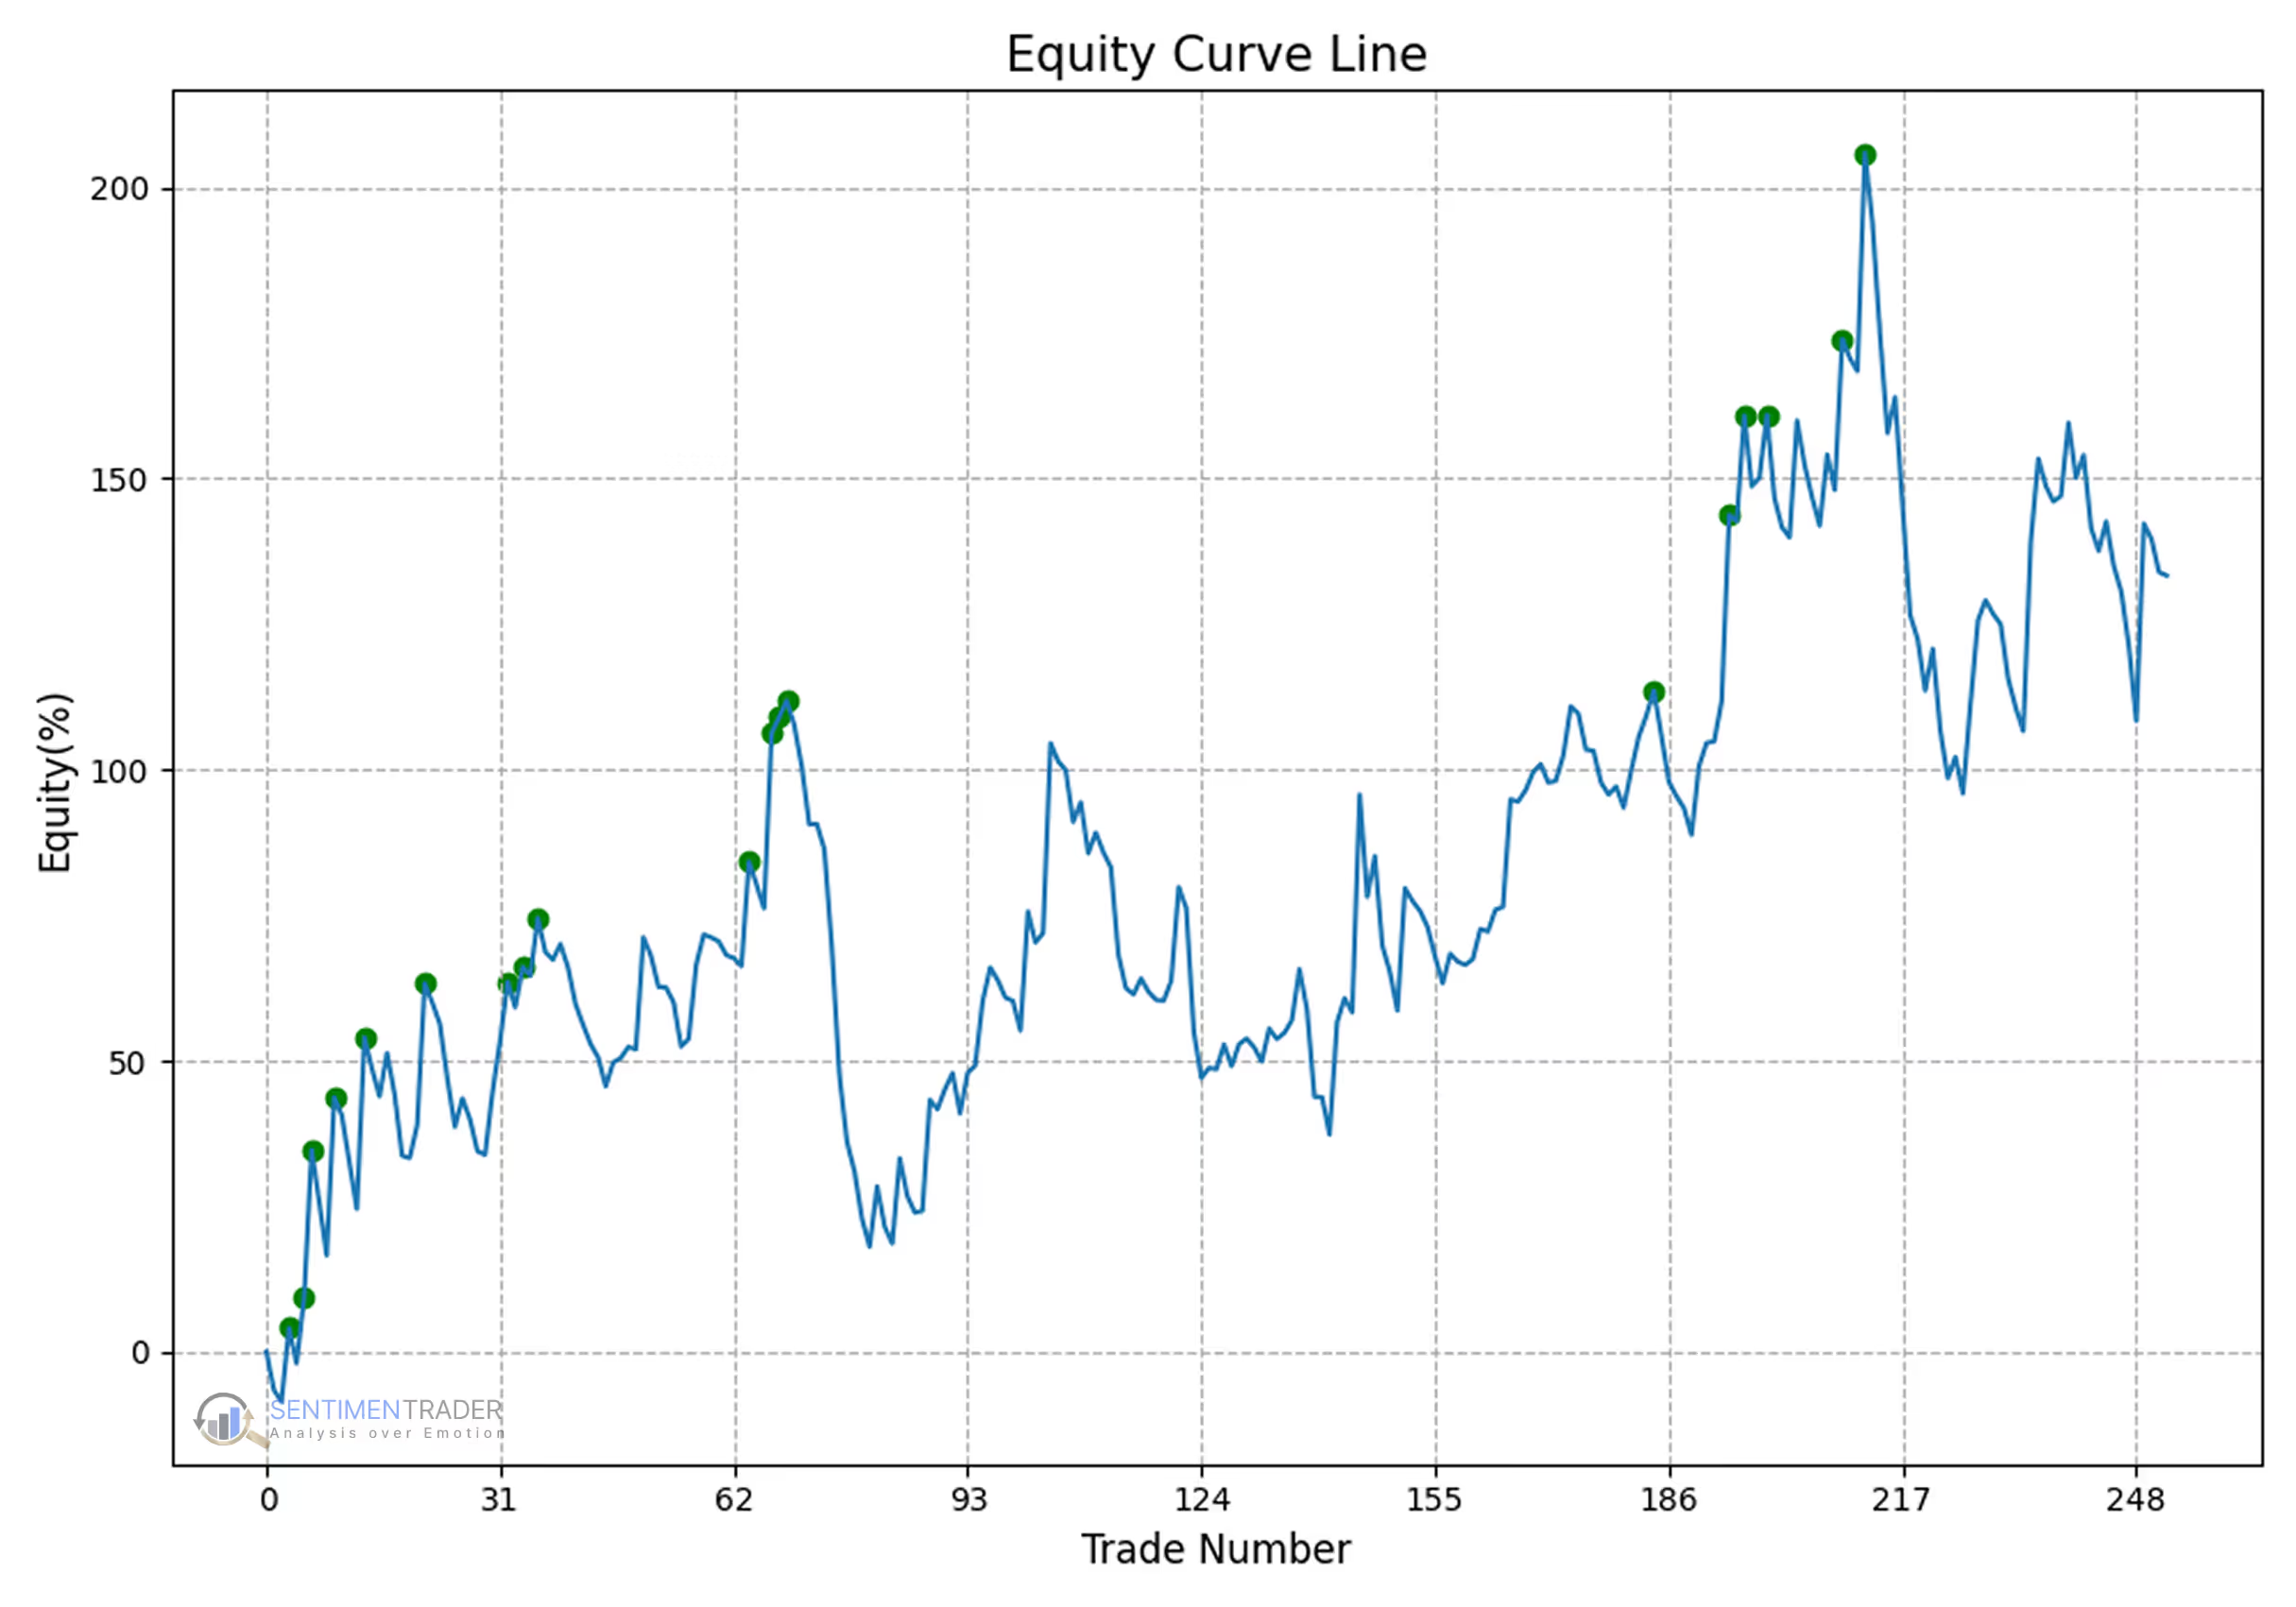
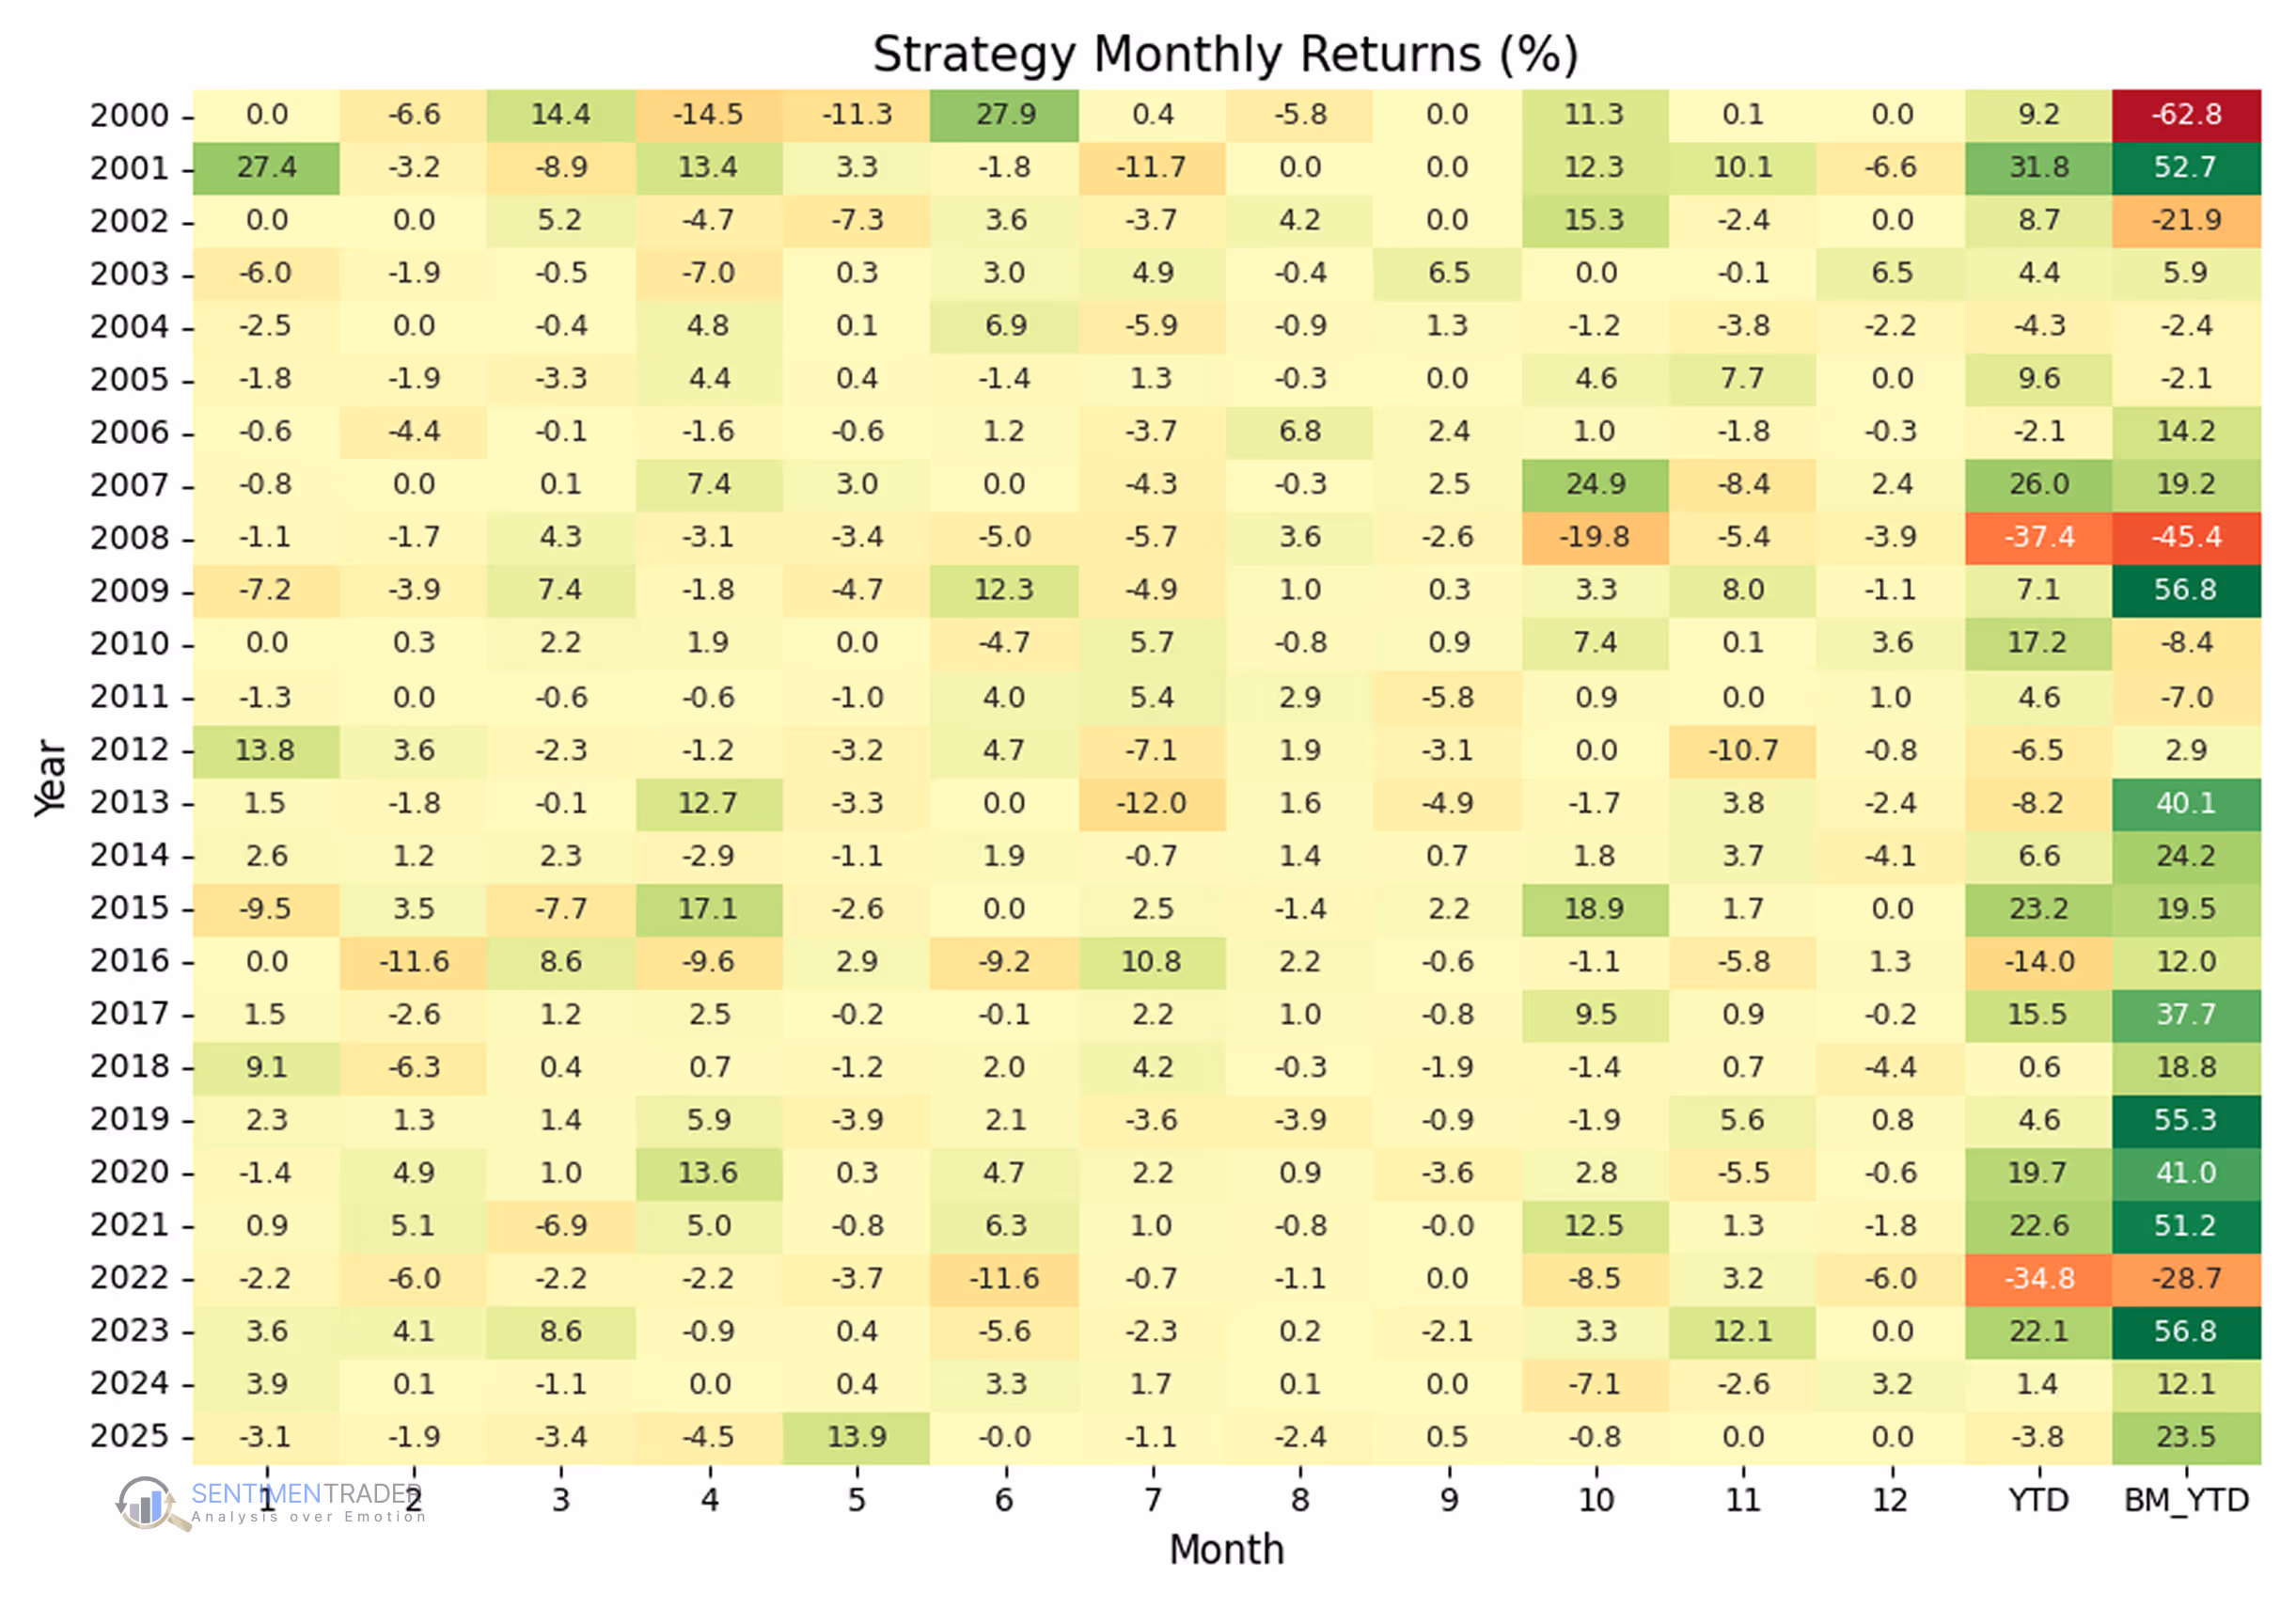
Results over 25 years:
+133% total return (vs. +791% for buy-and-hold).
Smaller drawdowns: −51% vs. −70%+ during major crashes.
Moderate activity: 252 trades with a 39.7% win rate.
In the market only 50% of the time, reducing exposure to prolonged declines.
Takeaway: Even though MACD doesn’t capture every move, it has historically helped traders stay aligned with major momentum phases while avoiding much of the downside in weak or sideways markets.
This backtest was run using SentimenTrader's Proprietary Backtest Engine, which lets you test your strategy with nearly 100 technical indicators and over 17,000 indicators covering Sentiment, Trend Score, Breadth, Macro, and Seasonality. No coding required.
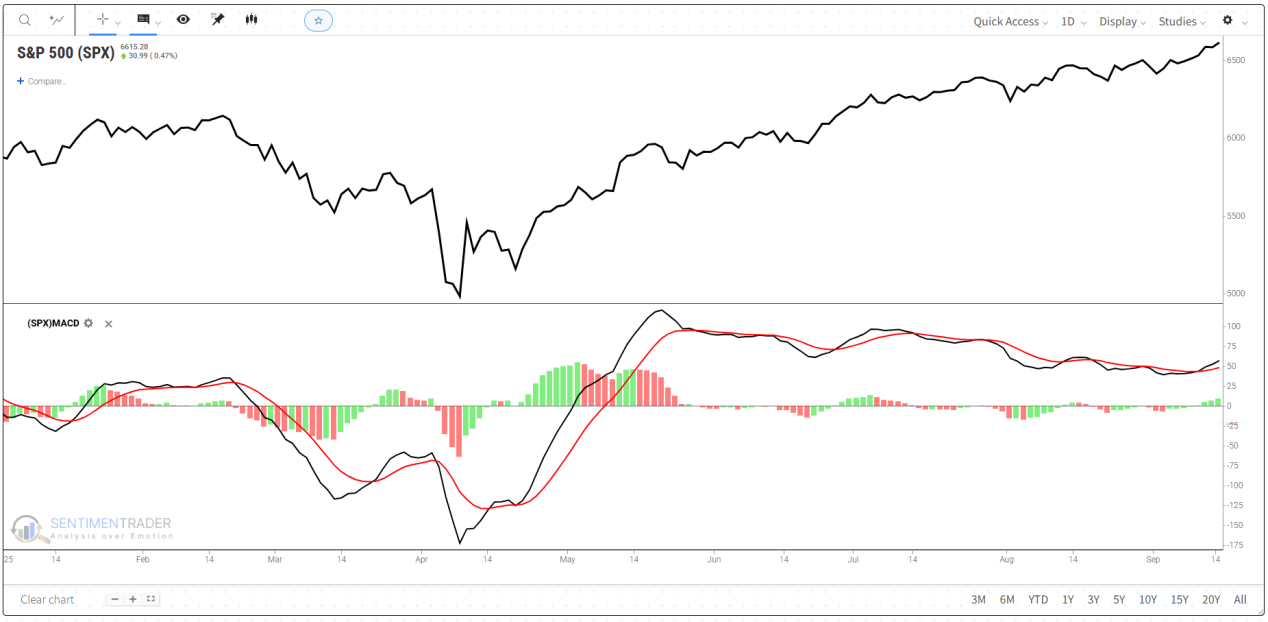
The Technical Bit
MACD is built from two Exponential Moving Averages (EMAs):
Quick note on EMA: An Exponential Moving Average (EMA) is a type of moving average that gives more weight to recent prices, making it react faster to new moves. In MACD, the 12-period EMA (short-term) and the 26-period EMA (long-term) are compared to show whether short-term momentum is stronger or weaker than the broader trend. MACD Line: The difference between short-term and long-term momentum. Expands when momentum accelerates; contracts when momentum fades.
MACD Line = 12-period EMA – 26-period EMA
Signal Line: A smoother version of the MACD line, crossovers often mark momentum shifts.
Signal Line = 9-period EMA of the MACD Line
Histogram: Shows the gap between the MACD line and Signal line. Rising bars indicate widening momentum; shrinking bars indicate momentum loss. Bars above zero suggest bullish momentum, while bars below zero suggest bearish momentum.
Histogram = MACD Line – Signal Line
Common settings and tweaks: The default is 12/26/9 on daily charts. Traders sometimes adjust these numbers—shorter periods (e.g., 8/21/9) react faster but create more signals, while longer periods (e.g., 19/39/9) react more slowly but filter out noise.
What This Means for Traders
MACD won’t predict exact tops or bottoms, but it gives you:
A clearer view of when momentum is accelerating or fading.
Defined signals to help avoid purely emotional decisions.
A framework to confirm shifts when combined with other tools.
It’s one of the most widely used Momentum indicators in technical analysis. Still, because it’s based on past prices, MACD can lag during sharp reversals and generate false signals in sideways markets. That’s why traders often pair it with indicators from other categories—for example, Moving Averages (Trend indicator) to confirm direction, On-Balance Volume (OBV) (Volume indicator) to validate pressure behind a move, or Bollinger Bands (Volatility indicator) to see if momentum is stretching beyond normal ranges.
Using MACD together with these widely used tools helps traders filter out false signals and focus on meaningful momentum shifts.