Why RSI Matter
Markets don’t just move—they speed up and slow down. RSI turns that pace into a simple number, so you can quickly see when momentum is strong, fading, or potentially reversing.
Clarity: A single oscillator highlights when recent moves look stretched relative to the recent past.
Momentum insight: Flags shifts (divergence, crosses, ranges) that often precede price turns or continuation after pullbacks.
Flexibility: Works across assets and timeframes; thresholds can be adapted to trend strength.
Real-World Results: Do They Actually Work?
To see how RSI performs when used as a momentum-confirmation tool, we tested a CrossAbove 40 strategy on QQQ from 2005 to 2025.
Results over 20 years:
+318.6 % total return (vs. +1455.5 % for buy-and-hold).
Smaller drawdowns: roughly –27 % vs. –50 %+ for QQQ in major crashes.
Fewer decisions: 19 trades in 20 years with a 42 % win rate.
Average gain +25.1 % vs. average loss –2.8 %.
Time in market: 54.6 %, reducing exposure by nearly half.
Long-term follow-through: Median gain +11.8 % after 6 months and +20.8 % after 1 year following a signal.
Takeaway: Even though RSI CrossAbove 40 didn’t beat buy-and-hold, it historically provided smoother participation in sustained uptrends and helped avoid deep equity declines during bear markets. It worked best as a confirmation signal — re-entering after pullbacks rather than calling exact bottoms.
This backtest was run using SentimenTrader's Proprietary Backtest Engine, which lets you test your strategy with nearly 100 technical indicators and over 17,000 indicators covering Sentiment, Trend Score, Breadth, Macro, and Seasonality. No coding required.
The Technical Bit
Calculation and Components
RSI compares the average gain to the average loss over a chosen period (default 14), then rescales the result to a 0–100 range.
Formula:
Where:
Average gain and average loss: Calculate the closing price changes for each of the past n periods (default is 14). Gains count as positive values, losses count as positive values in the loss bucket. From the 15th period onward, Wilder’s smoothing method is applied to update the averages, which keeps RSI responsive without recalculating a fresh arithmetic mean each time.
Settings
Default lookback: 14 periods.
Shorter (e.g., 7–9): More sensitive, more signals (and more noise).
Longer (e.g., 21–30): Smoother, fewer signals, slower to react.
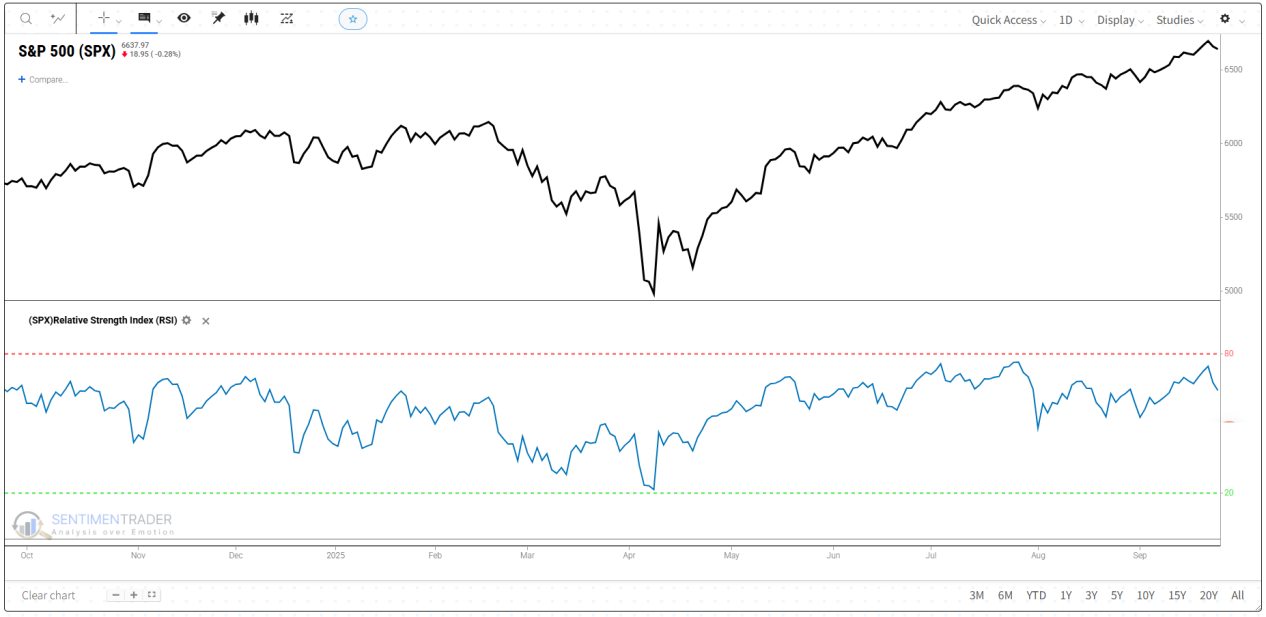
Threshold tweaks: Keep 70/30 for ranges; consider 80/40 or 60/40-style adaptations in strong trends (many traders simply monitor 40–50 supports in uptrends and 50–60 caps in downtrends).
Variations you may encounter:
Stochastic RSI: makes RSI even more sensitive, showing where RSI sits compared to its own highs and lows.
Modified RSI (with volatility inputs): adds volatility (like how “wild” prices are) to reduce false signals.
What This Means for Traders
RSI simplifies momentum into one number, adding discipline when emotions run hot. It can help you spot stretches, time pullbacks within trends, and notice when momentum stops confirming price.
Still, RSI can stay extreme during powerful trends and whipsaw in choppy markets. That’s why many traders pair it with tools from other categories—for example, Moving Averages (Trend) for direction context, On-Balance Volume (Volume) for participation, or Bollinger Bands (Volatility) to see if moves are outside typical ranges. Combining evidence—and validating ideas with a backtest—helps separate robust signals from noise.


_2.avif)
_3.avif)
_3.5.avif)
_4.avif)
_5.avif)
_6.avif)
_7.avif)
_8.avif)
_9.avif)
_10.avif)