Why Bollinger Bands Matter
Markets don’t move at a steady pace—sometimes they surge with energy, other times they quiet down. Bollinger Bands adapt to these shifts by wrapping price in a dynamic channel that adjusts with volatility.
Clarity: Show when markets are unusually stretched versus their average.
Flexibility: Work across timeframes and assets, from intraday to long-term.
Volatility Gauge: Band width itself is a direct measure of market activity.
How Traders Use Bollinger Bands
Measuring volatility: Bands widen when price swings increase, and contract during calm phases.
Overbought / Oversold levels: Touching the upper band often signals stretched conditions; touching the lower band suggests the opposite.
Trend confirmation: In uptrends, prices tend to “walk the upper band.” In downtrends, they hug the lower band.
Breakouts (Band Squeeze): A tight band squeeze can foreshadow a large move once volatility returns.
Real-World Results: Do They Actually Work?
To evaluate how well Bollinger Bands highlight volatility-driven opportunities, we ran a backtest on TSLA using a Bollinger Bands Breakout setup.
Results over 10 years:
+2,085.6 % total return (vs. +2,864.4 % for buy-and-hold).
32.9 % CAGR, showing strong compounding across multiple bull cycles.
Smaller drawdowns: –33.7 % max risk, substantially lower than TSLA’s –60 %+ declines in major sell-offs.
Moderate activity: 45 trades over 10 years with a 48.9 % win rate.
Time in market: 32 %, reducing exposure while capturing key trend bursts.
Takeaway: Even though this breakout approach underperformed pure buy-and-hold during TSLA’s massive rallies, it historically delivered smoother participation in high-volatility moves and limited drawdowns by reducing time in the market. It worked best as a volatility-filtering method for capturing large expansions while avoiding extended sideways noise.
This backtest was run using SentimenTrader's Proprietary Backtest Engine, which lets you test your strategy with nearly 100 technical indicators and over 17,000 indicators covering Sentiment, Trend Score, Breadth, Macro, and Seasonality. No coding required.
The Technical Bit
Calculation and Components
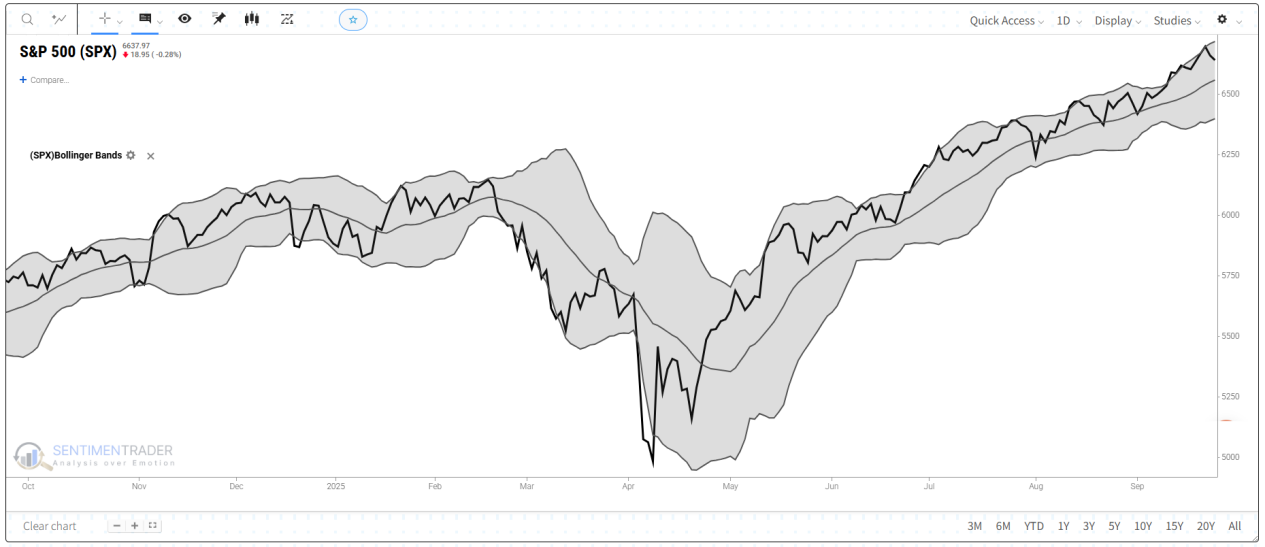
Middle Band (SMA): A 20-day simple moving average of closing prices.
Upper Band: Middle Band + (2 × 20-day standard deviation).
Lower Band: Middle Band – (2 × 20-day standard deviation).
Quick note on Simple Moving Average (SMA): This is the average of closing prices over a set period, with each day given equal weight. In Bollinger Bands, the SMA acts as the baseline for measuring how far price has stretched. Common settings and tweaks:
Default: 20-day SMA with 2 standard deviations.
Shorter lookbacks (e.g., 10-day): More sensitive, more signals, more noise.
Longer lookbacks (e.g., 50-day): Smoother, fewer signals, slower reactions.
Adjustable deviation factor: Increasing widens the bands, decreasing tightens them.
What This Means for Traders
Bollinger Bands don’t forecast where price will go next, but they highlight when conditions are stretched or unusually quiet. They can provide discipline when emotions might suggest chasing moves.
Still, Bollinger Bands can give false signals—especially in sideways markets where price whipsaws between bands. That’s why traders often combine them with other tools: for example, RSI (Momentum) to confirm overbought/oversold, On-Balance Volume (Volume) to check participation, or Moving Averages (Trend) to confirm direction.


.avif)
.avif)
.avif)
.avif)
.avif)
.avif)
.avif)
.avif)


