Why Gold Hedgers Position Matters
Professional hedgers are often closer to the fundamental realities of the gold market than most investors. They hedge their physical exposure, and their collective positioning has historically anticipated major turning points in gold prices.
Clarity: Shows how commercial participants—the “smart money”—are positioned relative to their historical norms.
Context: Highlights when hedgers have taken unusually large long or short positions, suggesting potential inflection points.
Insight: Helps investors see through short-term noise to understand when insiders are protecting against or positioning for significant price moves.
How Traders Use the Gold Hedgers Position
Extreme Net Long (above green dotted line): Suggests heavy hedger accumulation, often preceding price rebounds.
Extreme Net Short (below red dotted line): Indicates aggressive hedging or selling pressure from commercial traders, historically aligning with price peaks.
Neutral Range: Positions within one standard deviation of the 3-year average typically align with stable or trend-following behavior.
Absolute Extremes: Even if readings don’t breach bands, unusually high or low net positions over several years may signal notable sentiment events worth attention.
The Technical Bit
Calculation and components
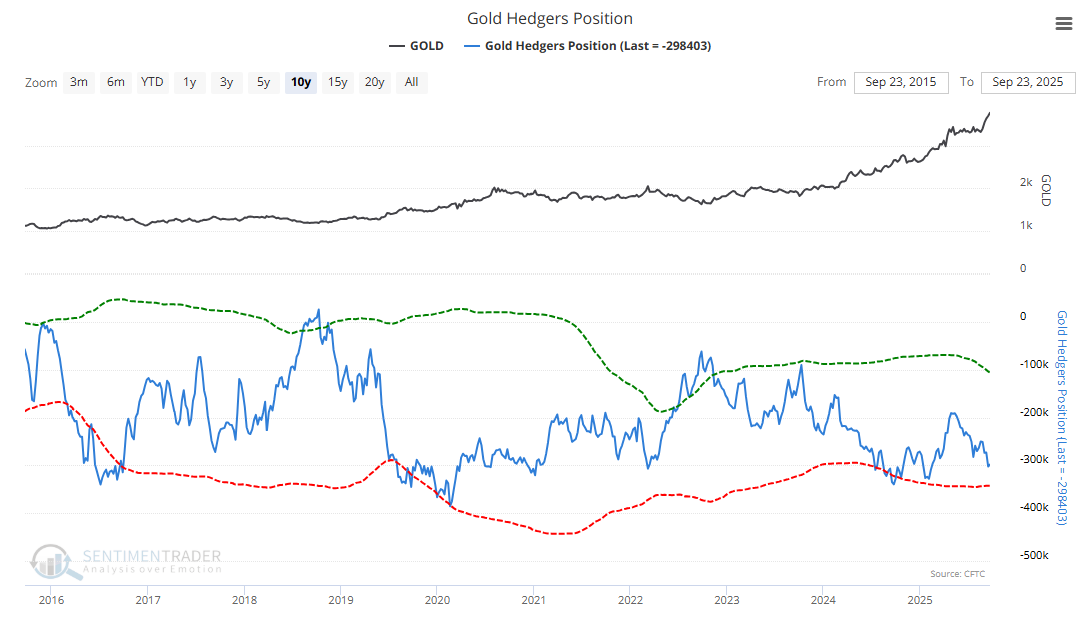
The Gold Hedgers Position chart plots the net number of gold futures contracts (longs minus shorts) held by commercial hedgers, based on data from the Commodity Futures Trading Commission’s weekly Commitments of Traders (COT) report.
The green dotted line marks one standard deviation above the 3-year average, representing unusually high net long positions.
The red dotted line marks one standard deviation below the 3-year average, showing extreme net short positioning.
Because hedgers typically take the opposite side of large speculators and small speculators, their positioning often leads market reversals.
Quick note: Standard deviation is a statistical measure that shows how much values vary from their average—helping to define “normal” versus “extreme” positioning.
What This Means for Traders
The Gold Hedgers Position reveals when industry professionals—those closest to the gold market—are hedging heavily or stepping back from risk. Persistent extremes in their positioning often hint at long-term shifts in supply-demand dynamics or investor sentiment.
While the indicator can highlight meaningful turning zones, extremes can persist. For this reason, many traders combine it with trend or momentum indicators to gauge whether price action supports the underlying sentiment signal.
This sentiment indicator is updated weekly and available through SentimenTrader’s platform, where it can also be analyzed with SentimenTrader’s Proprietary Backtest Engine to study how commercial hedging behavior has historically aligned with major moves in the gold market.