Why the Short-term Optimism Index (Optix) Matters
Market psychology can swing dramatically within days. The Short-term Optix quantifies these quick emotional shifts, capturing when traders collectively move from panic to euphoria—or vice versa—before prices fully reflect the change.
Clarity: Measures short-term crowd emotions using multiple high-frequency sentiment gauges.
Context: Highlights how optimism or pessimism clusters across several short-term inputs.
Insight: Flags conditions when emotions become stretched, providing early clues to exhaustion or rebound points.
How Traders Use the Short-term Optimism Index (Optix)
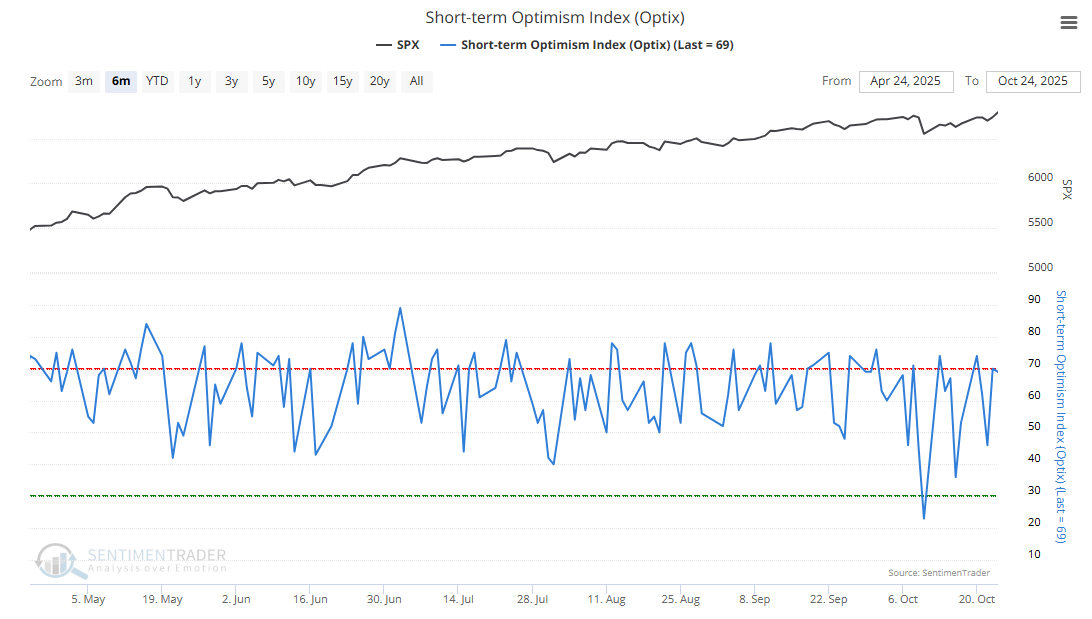
Above 60% (Excessive Optimism): Signals widespread short-term enthusiasm. Historically, these periods have often preceded mild pullbacks or consolidation.
Above 70% (Extreme Optimism): Indicates true euphoria across multiple measures; short-term risk tends to rise.
Below 40% (Excessive Pessimism): Reflects growing anxiety; historically followed by market bounces within days.
Below 30% (Extreme Pessimism): Suggests panic conditions; short-term rebounds often follow within 3–5 trading days.
Failure Signals: If stocks fail to rally after readings below 40% (or 30%), it can signal persistent supply and potential continuation of the downtrend.
The Technical Bit
Calculation and components
The Short-term Optimism Index (Optix) is derived by monitoring the extremes among short-term sentiment indicators that have historically proven most effective at spotting short-lived market turning points.
Each component within the Short-term Optix is scaled and bounded, ensuring that no single indicator can dominate the overall composite. By normalizing every input, the final score reflects a genuine confluence of extremes among multiple short-term sentiment measures rather than being skewed by isolated outliers.
Typical Components Include:
Price Oscillators: Capture short-term overbought or oversold momentum.
Cumulative Tick: Measures intraday buying and selling pressure.
Put/Call Ratios: Track speculative demand in the options market.
The resulting Optix value is displayed from 0% to 100%, where:
0–30% = Extreme pessimism
30–60% = Neutral or balanced sentiment
60–100% = Extreme optimism
What This Means for Traders
The Short-term Optix provides a snapshot of immediate crowd emotion, revealing when sentiment has moved too far, too fast. It helps traders anticipate short-term inflection points by showing whether optimism or pessimism is dominating the market mood.
Because emotional extremes can persist, traders often pair the Optix with trend or momentum indicators to confirm whether price direction aligns with the prevailing sentiment.
This is a proprietary SentimenTrader sentiment indicator, updated daily and available exclusively to subscribers. It can also be explored through SentimenTrader’s Proprietary Backtest Engine to quantify how short-term optimism and pessimism have historically aligned with market swings.