Why ADX/DMS Matters
Markets can move in trends or drift sideways, but not all moves carry the same weight. ADX/DMS helps traders see both who’s in control and how strong that control is:
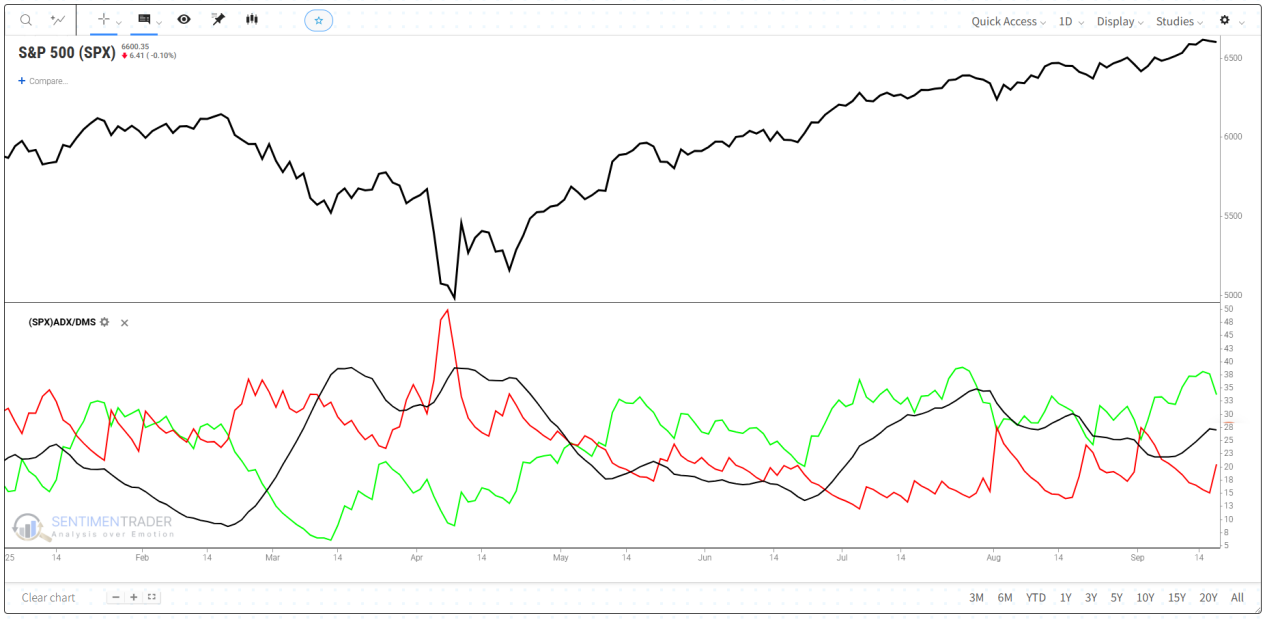
Direction & strength: +DI and –DI reveal which side is pressing harder, while ADX shows whether that pressure has enough force.
Simple signals: Three lines quickly show if a market is trending, weakening, or just range-bound.
Across markets: From daily charts in stocks to intraday moves in futures, ADX/DMS separates trends from noise.
Real-World Results: Do They Actually Work?
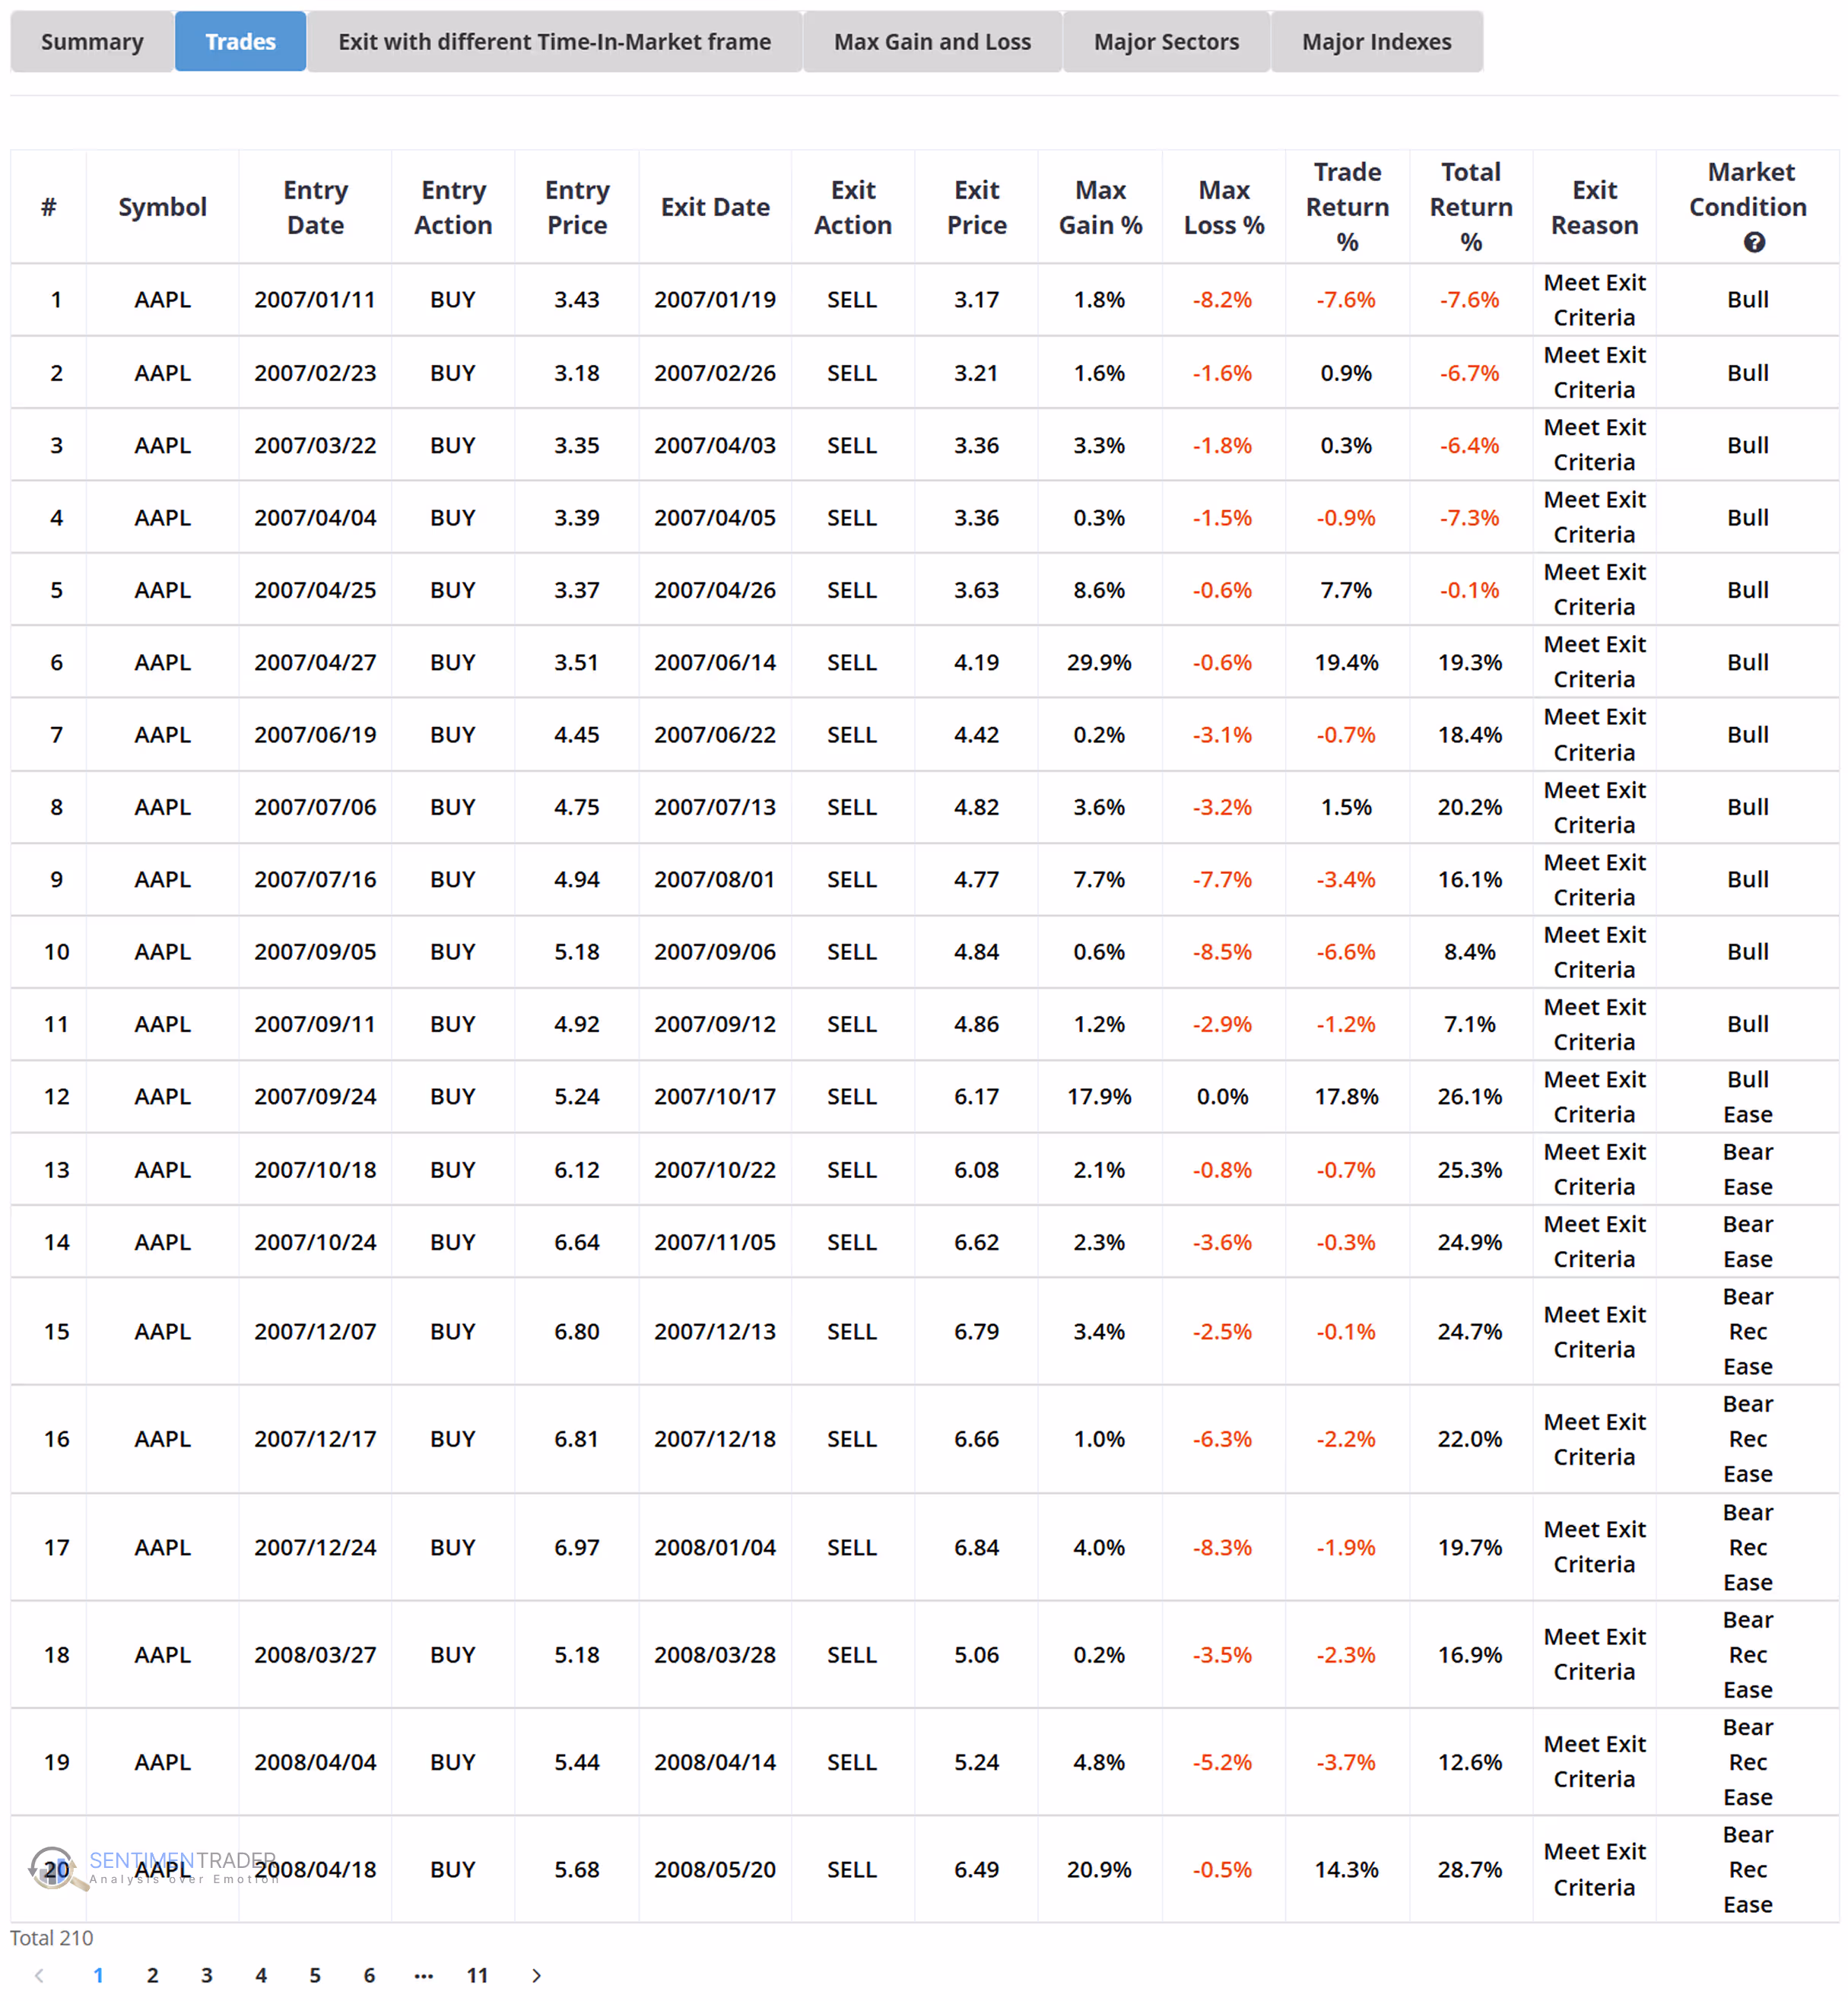
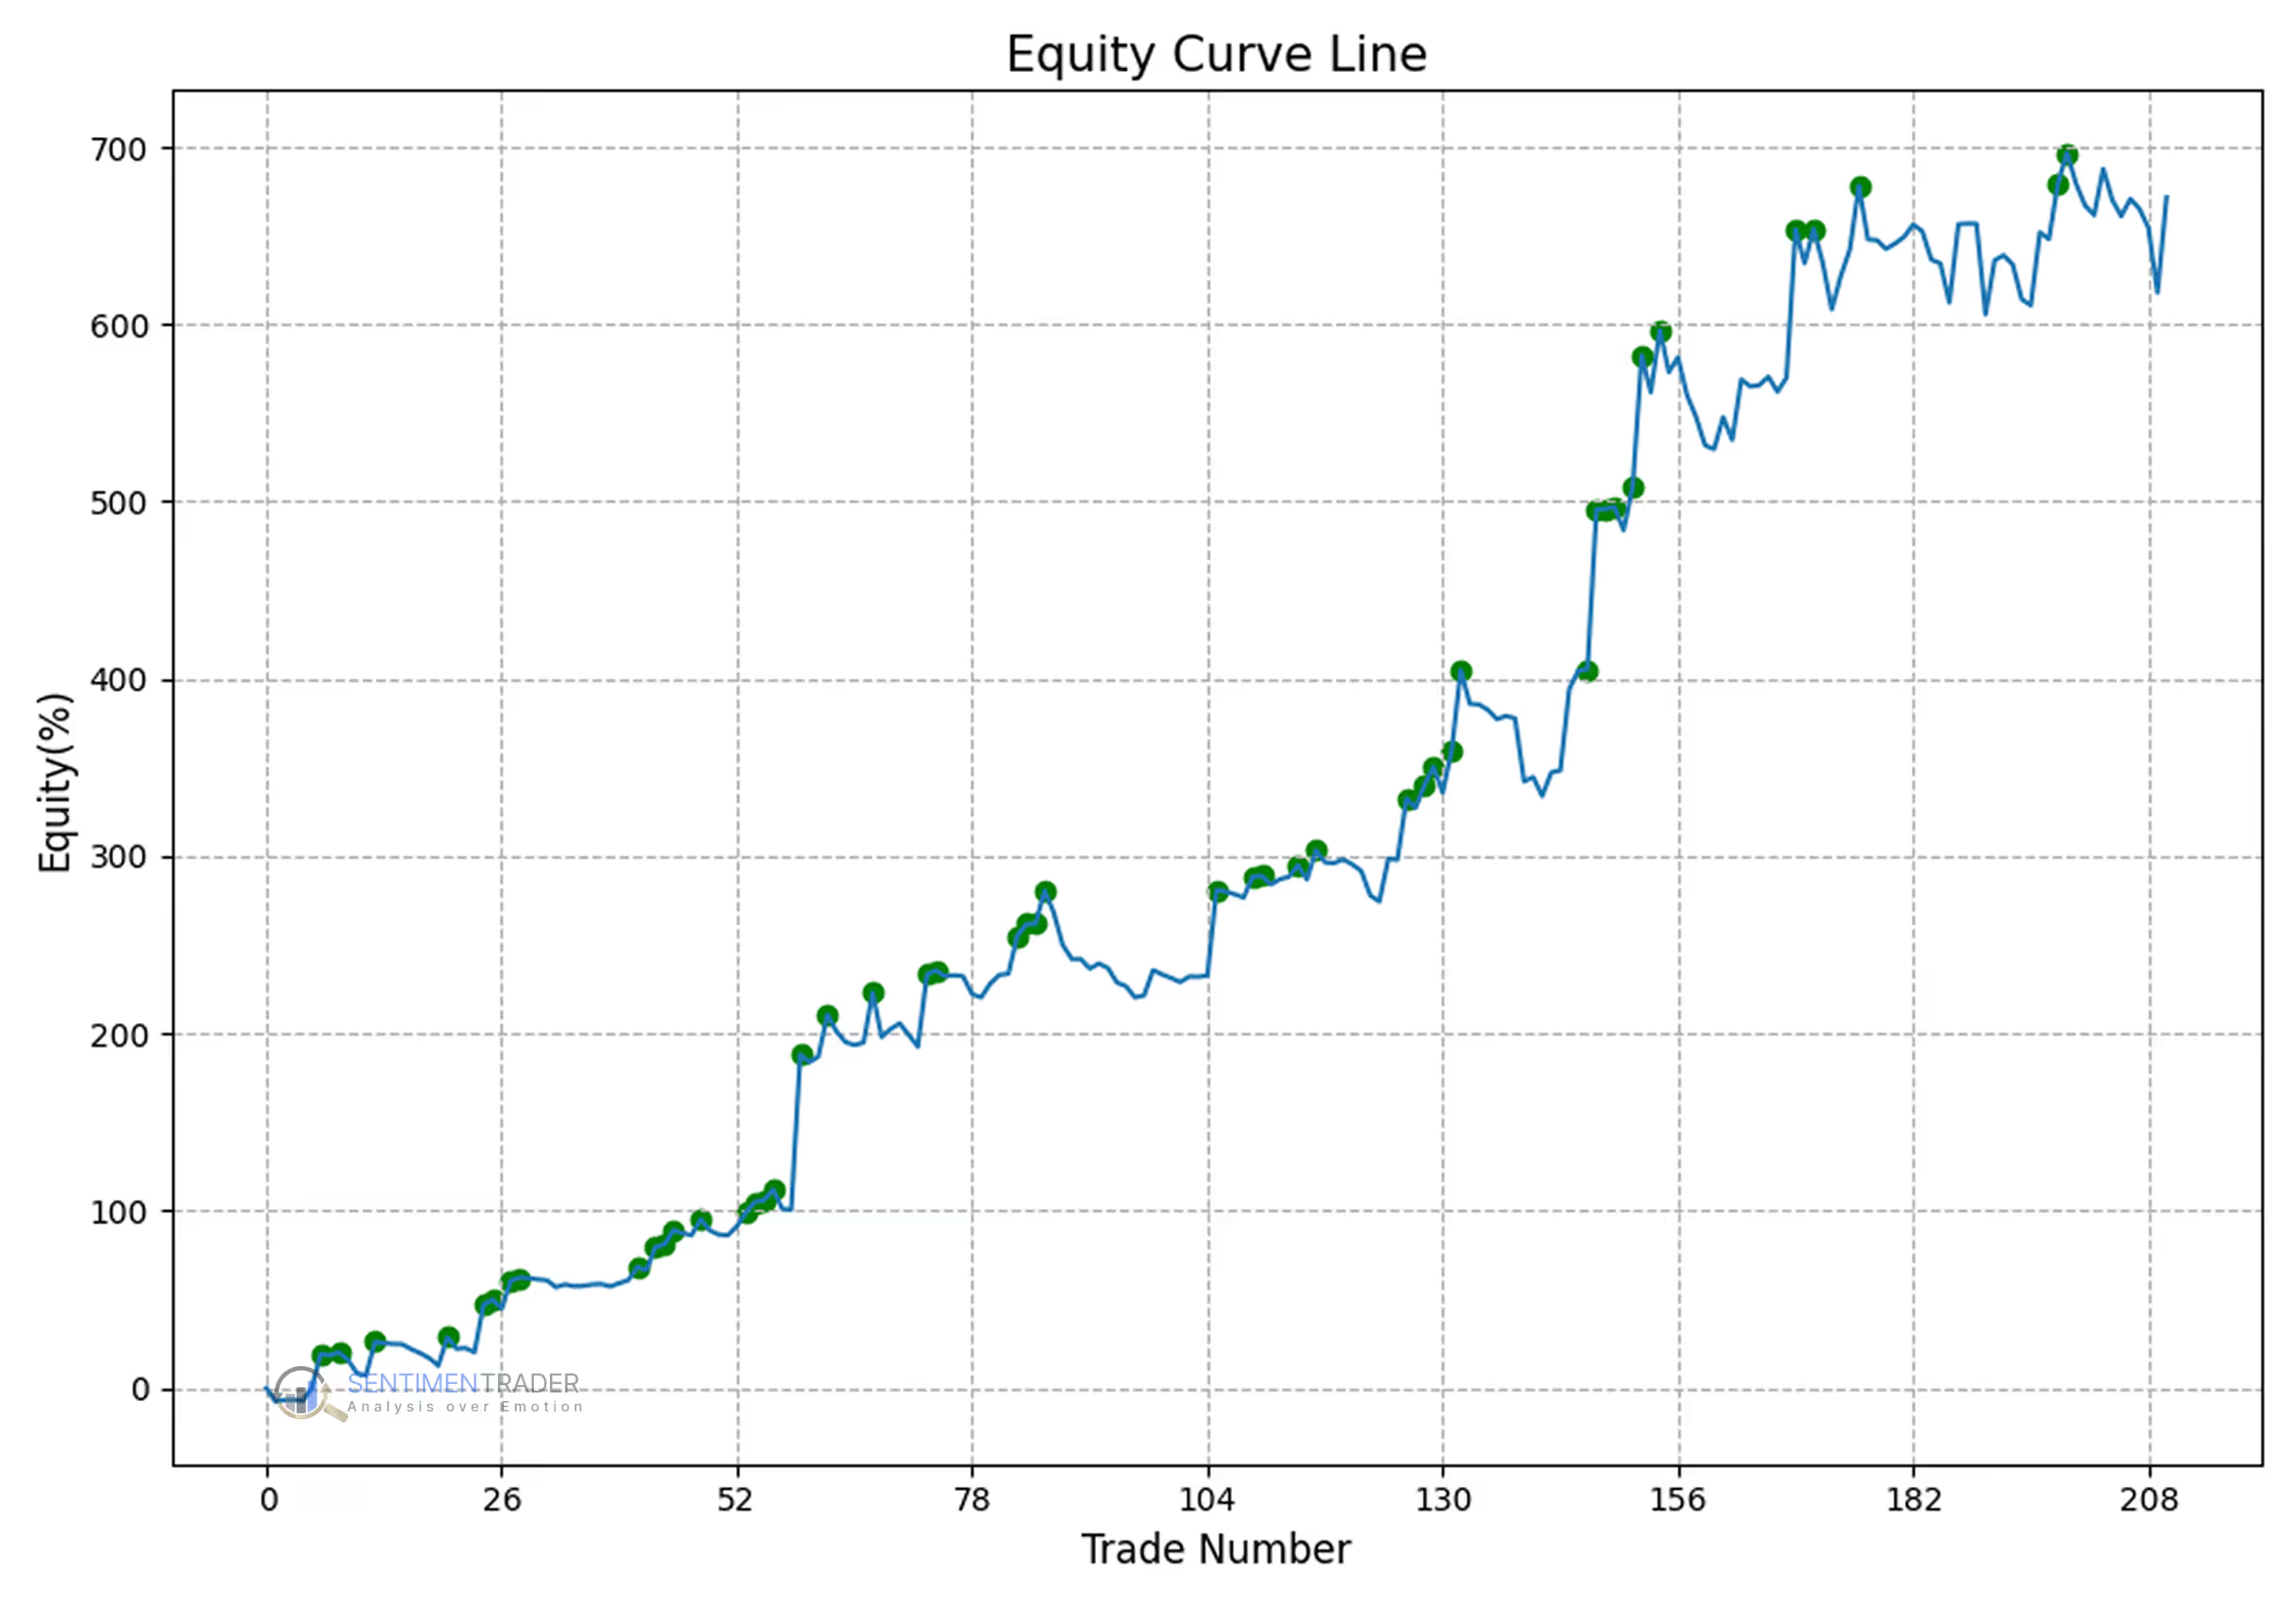
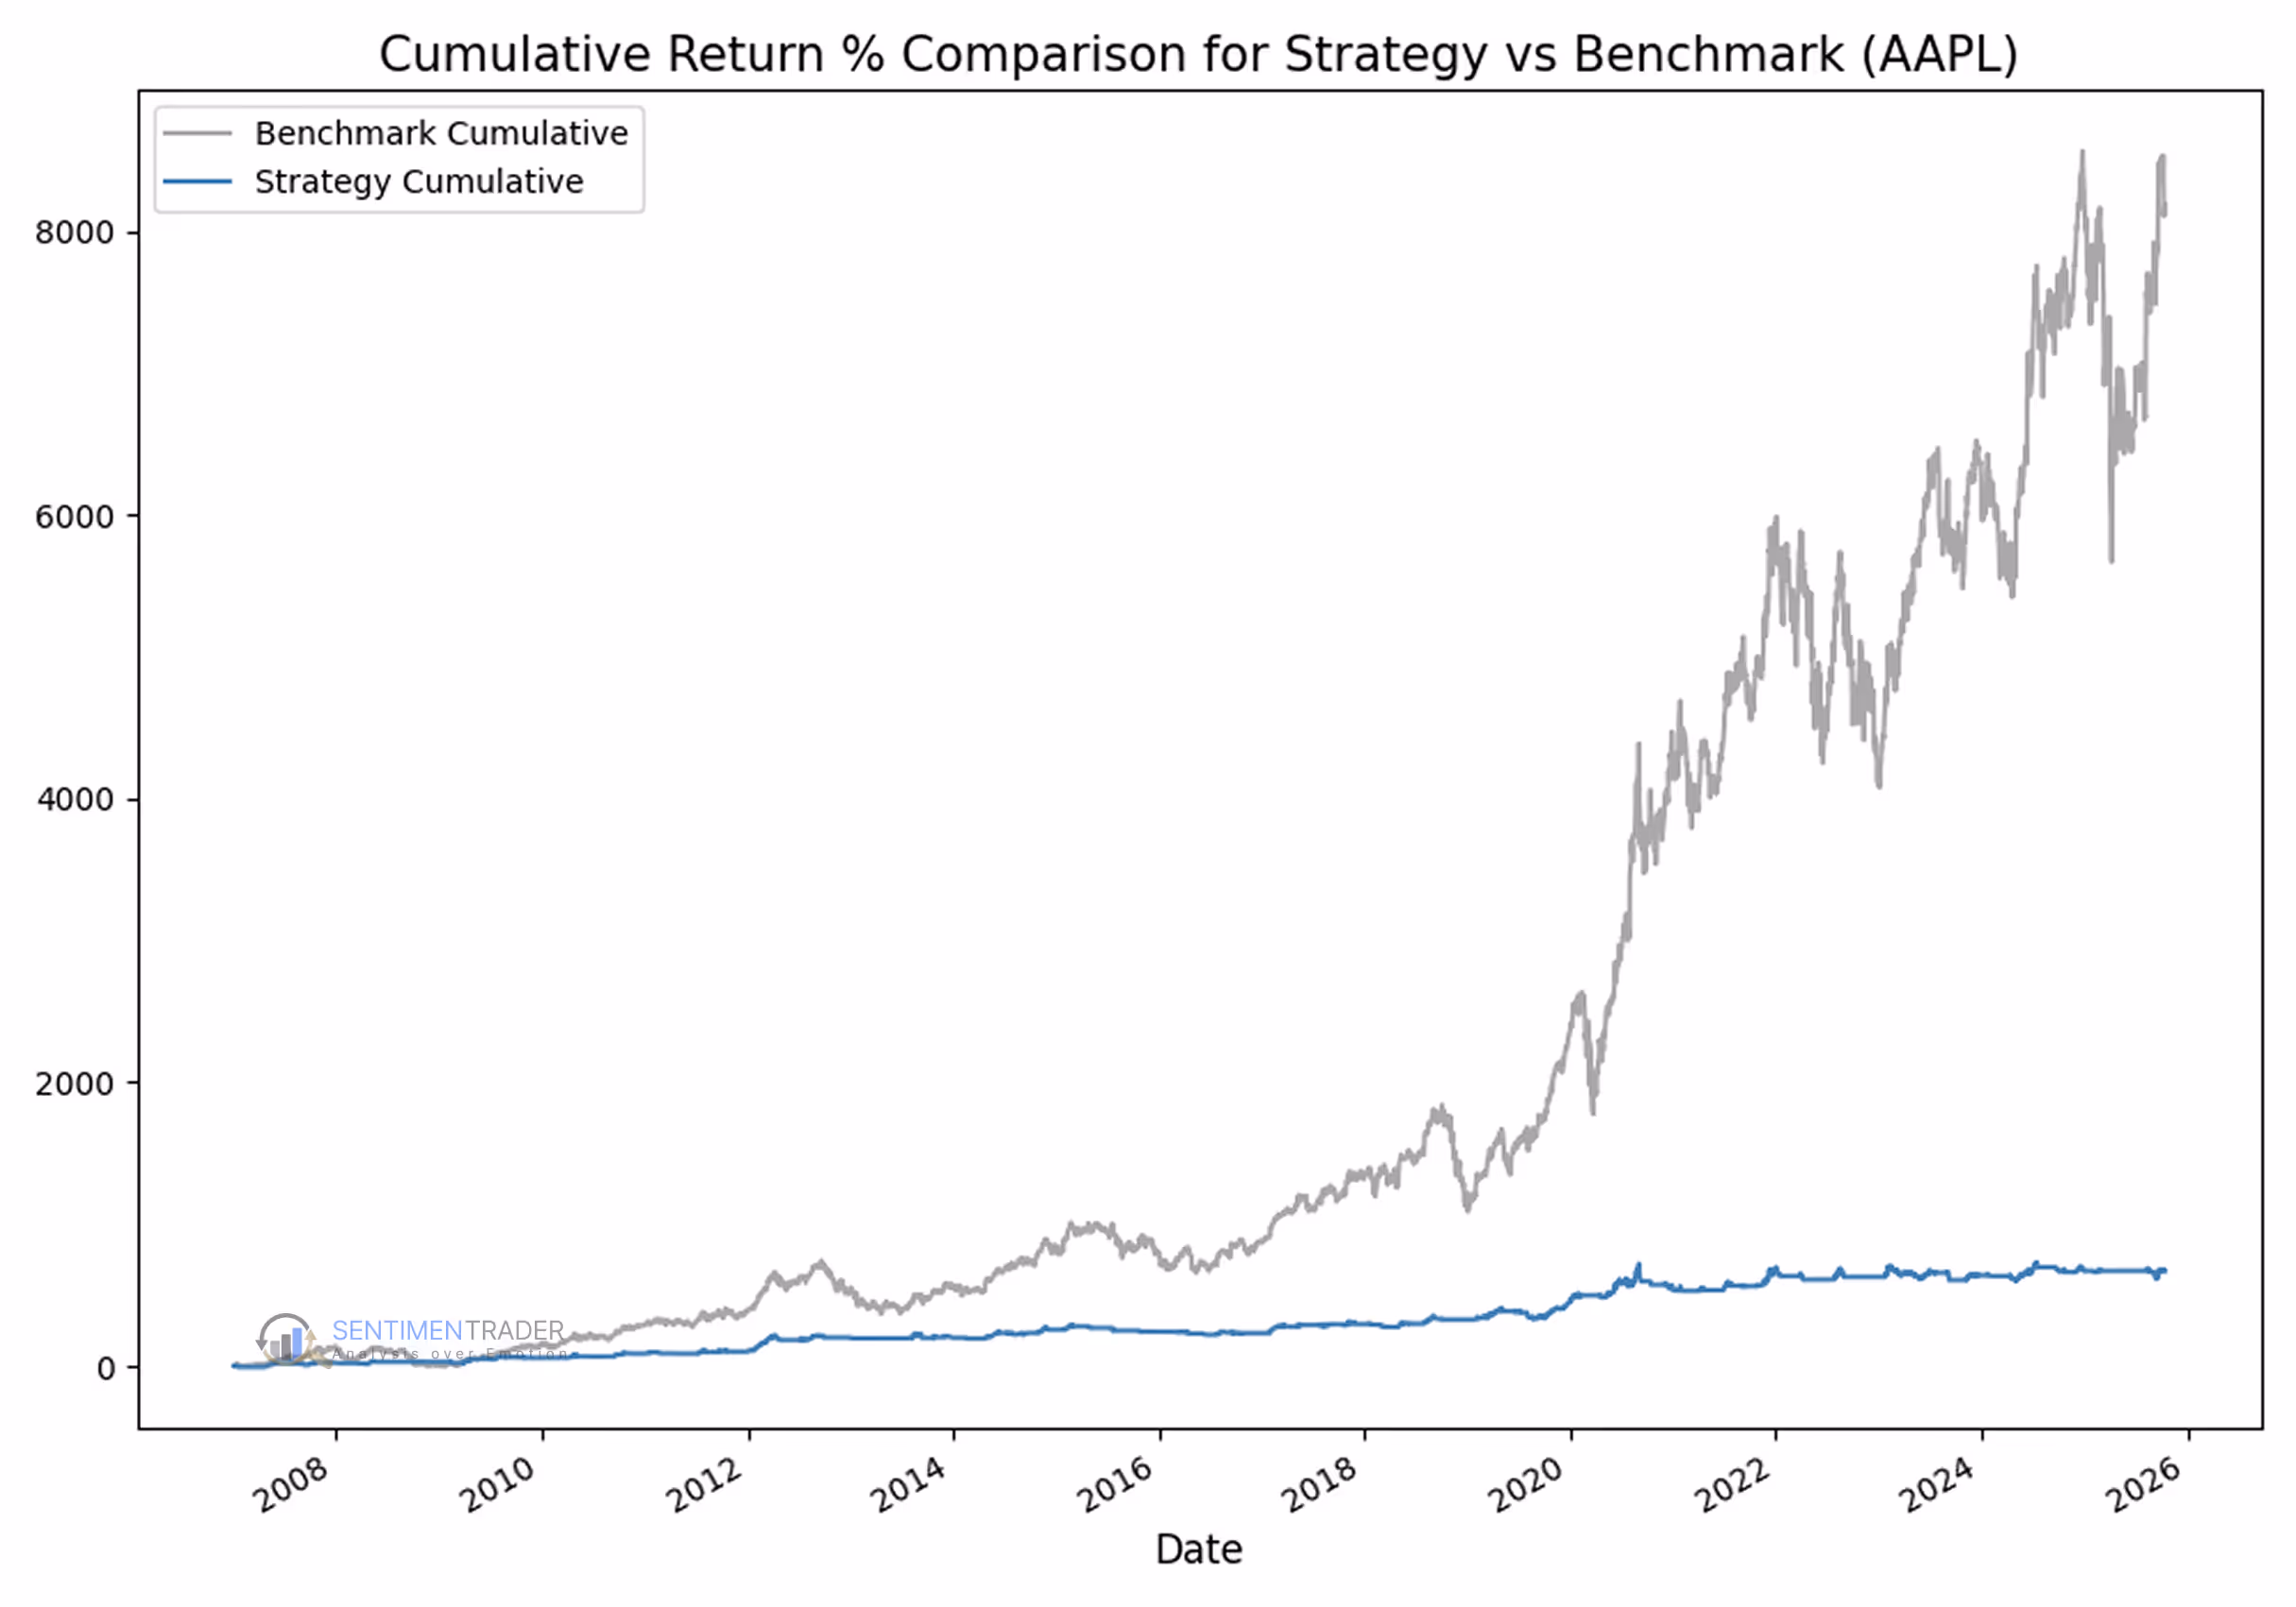
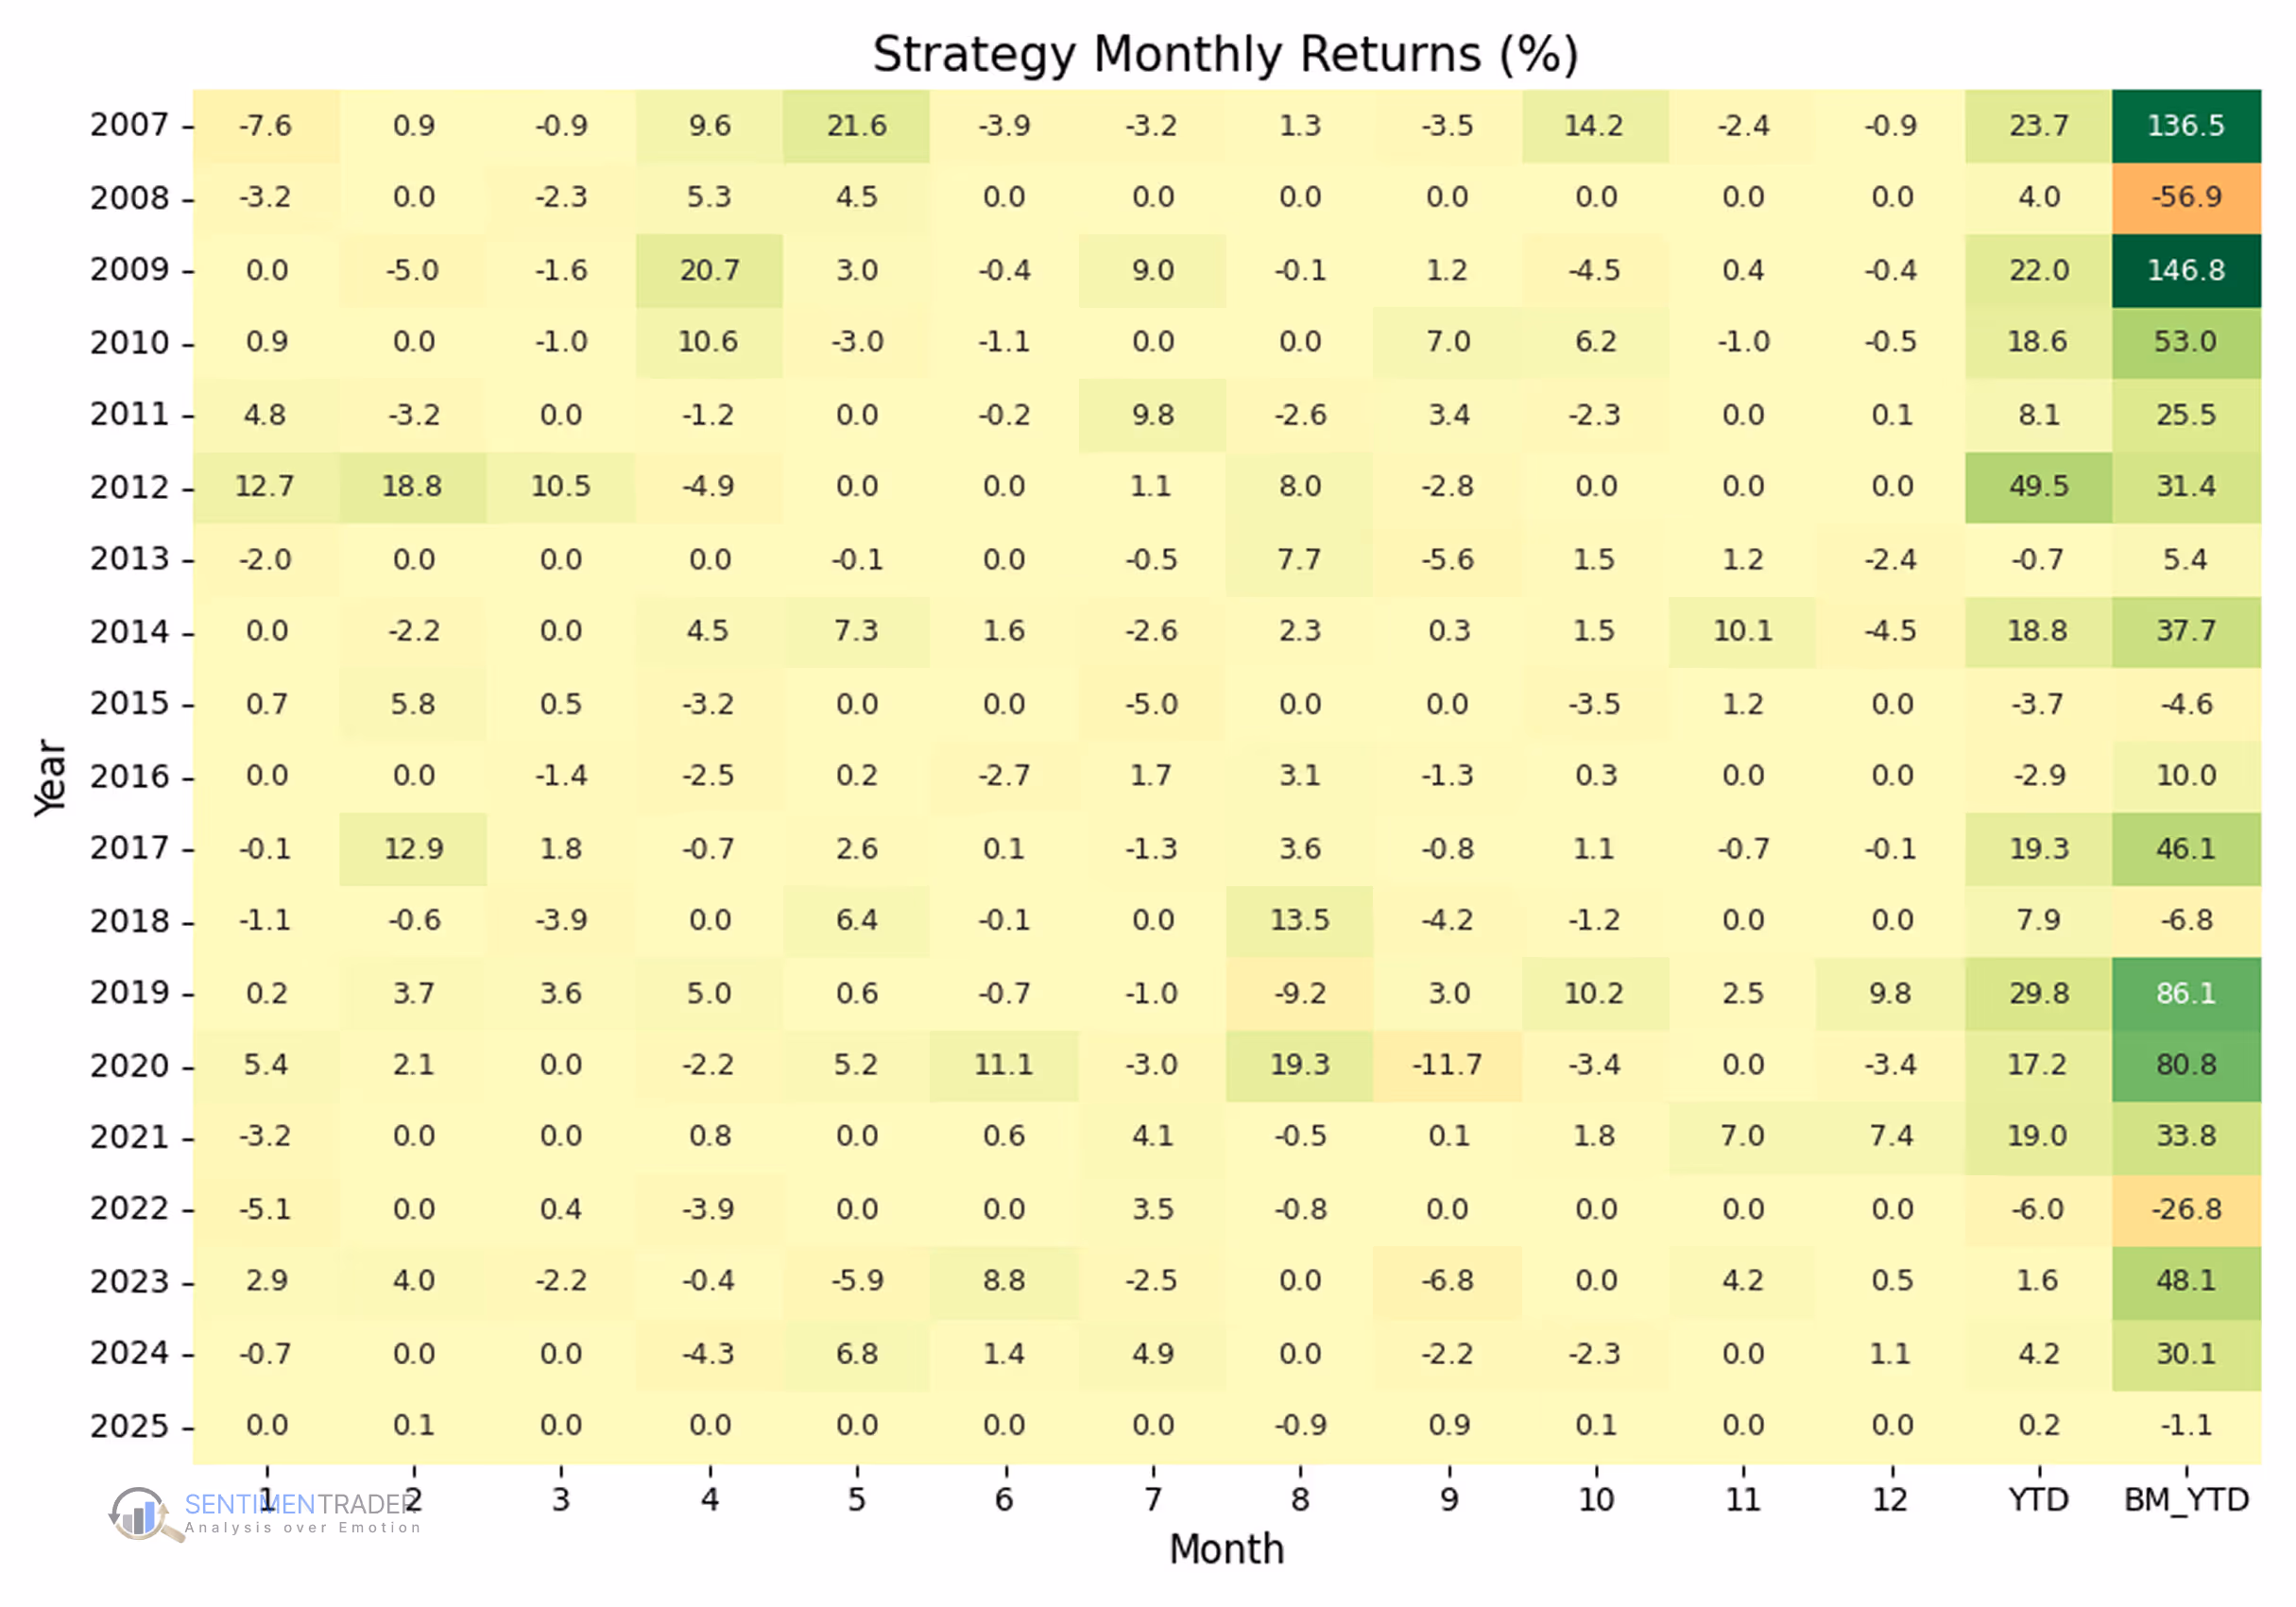
To see how well ADX/DMS identifies meaningful trends, we ran a backtest on Apple (AAPL) using a simple ADX CrossAbove 30 strategy:
Buy: When the ADX line crosses above 30, signaling a strong trend.
Sell: When it falls back below 30.
Results over 18 years:
+671% total return (vs. +7,906% for buy-and-hold).
Smaller drawdowns: −23% vs. −60%+ for AAPL in crashes.
Lower exposure: In the market only 32% of the time, with a 47% win rate.
Takeaway: Even though ADX/DMS doesn’t capture every move, it has historically helped traders stay aligned with strong, sustained trends while avoiding prolonged sideways or volatile periods.
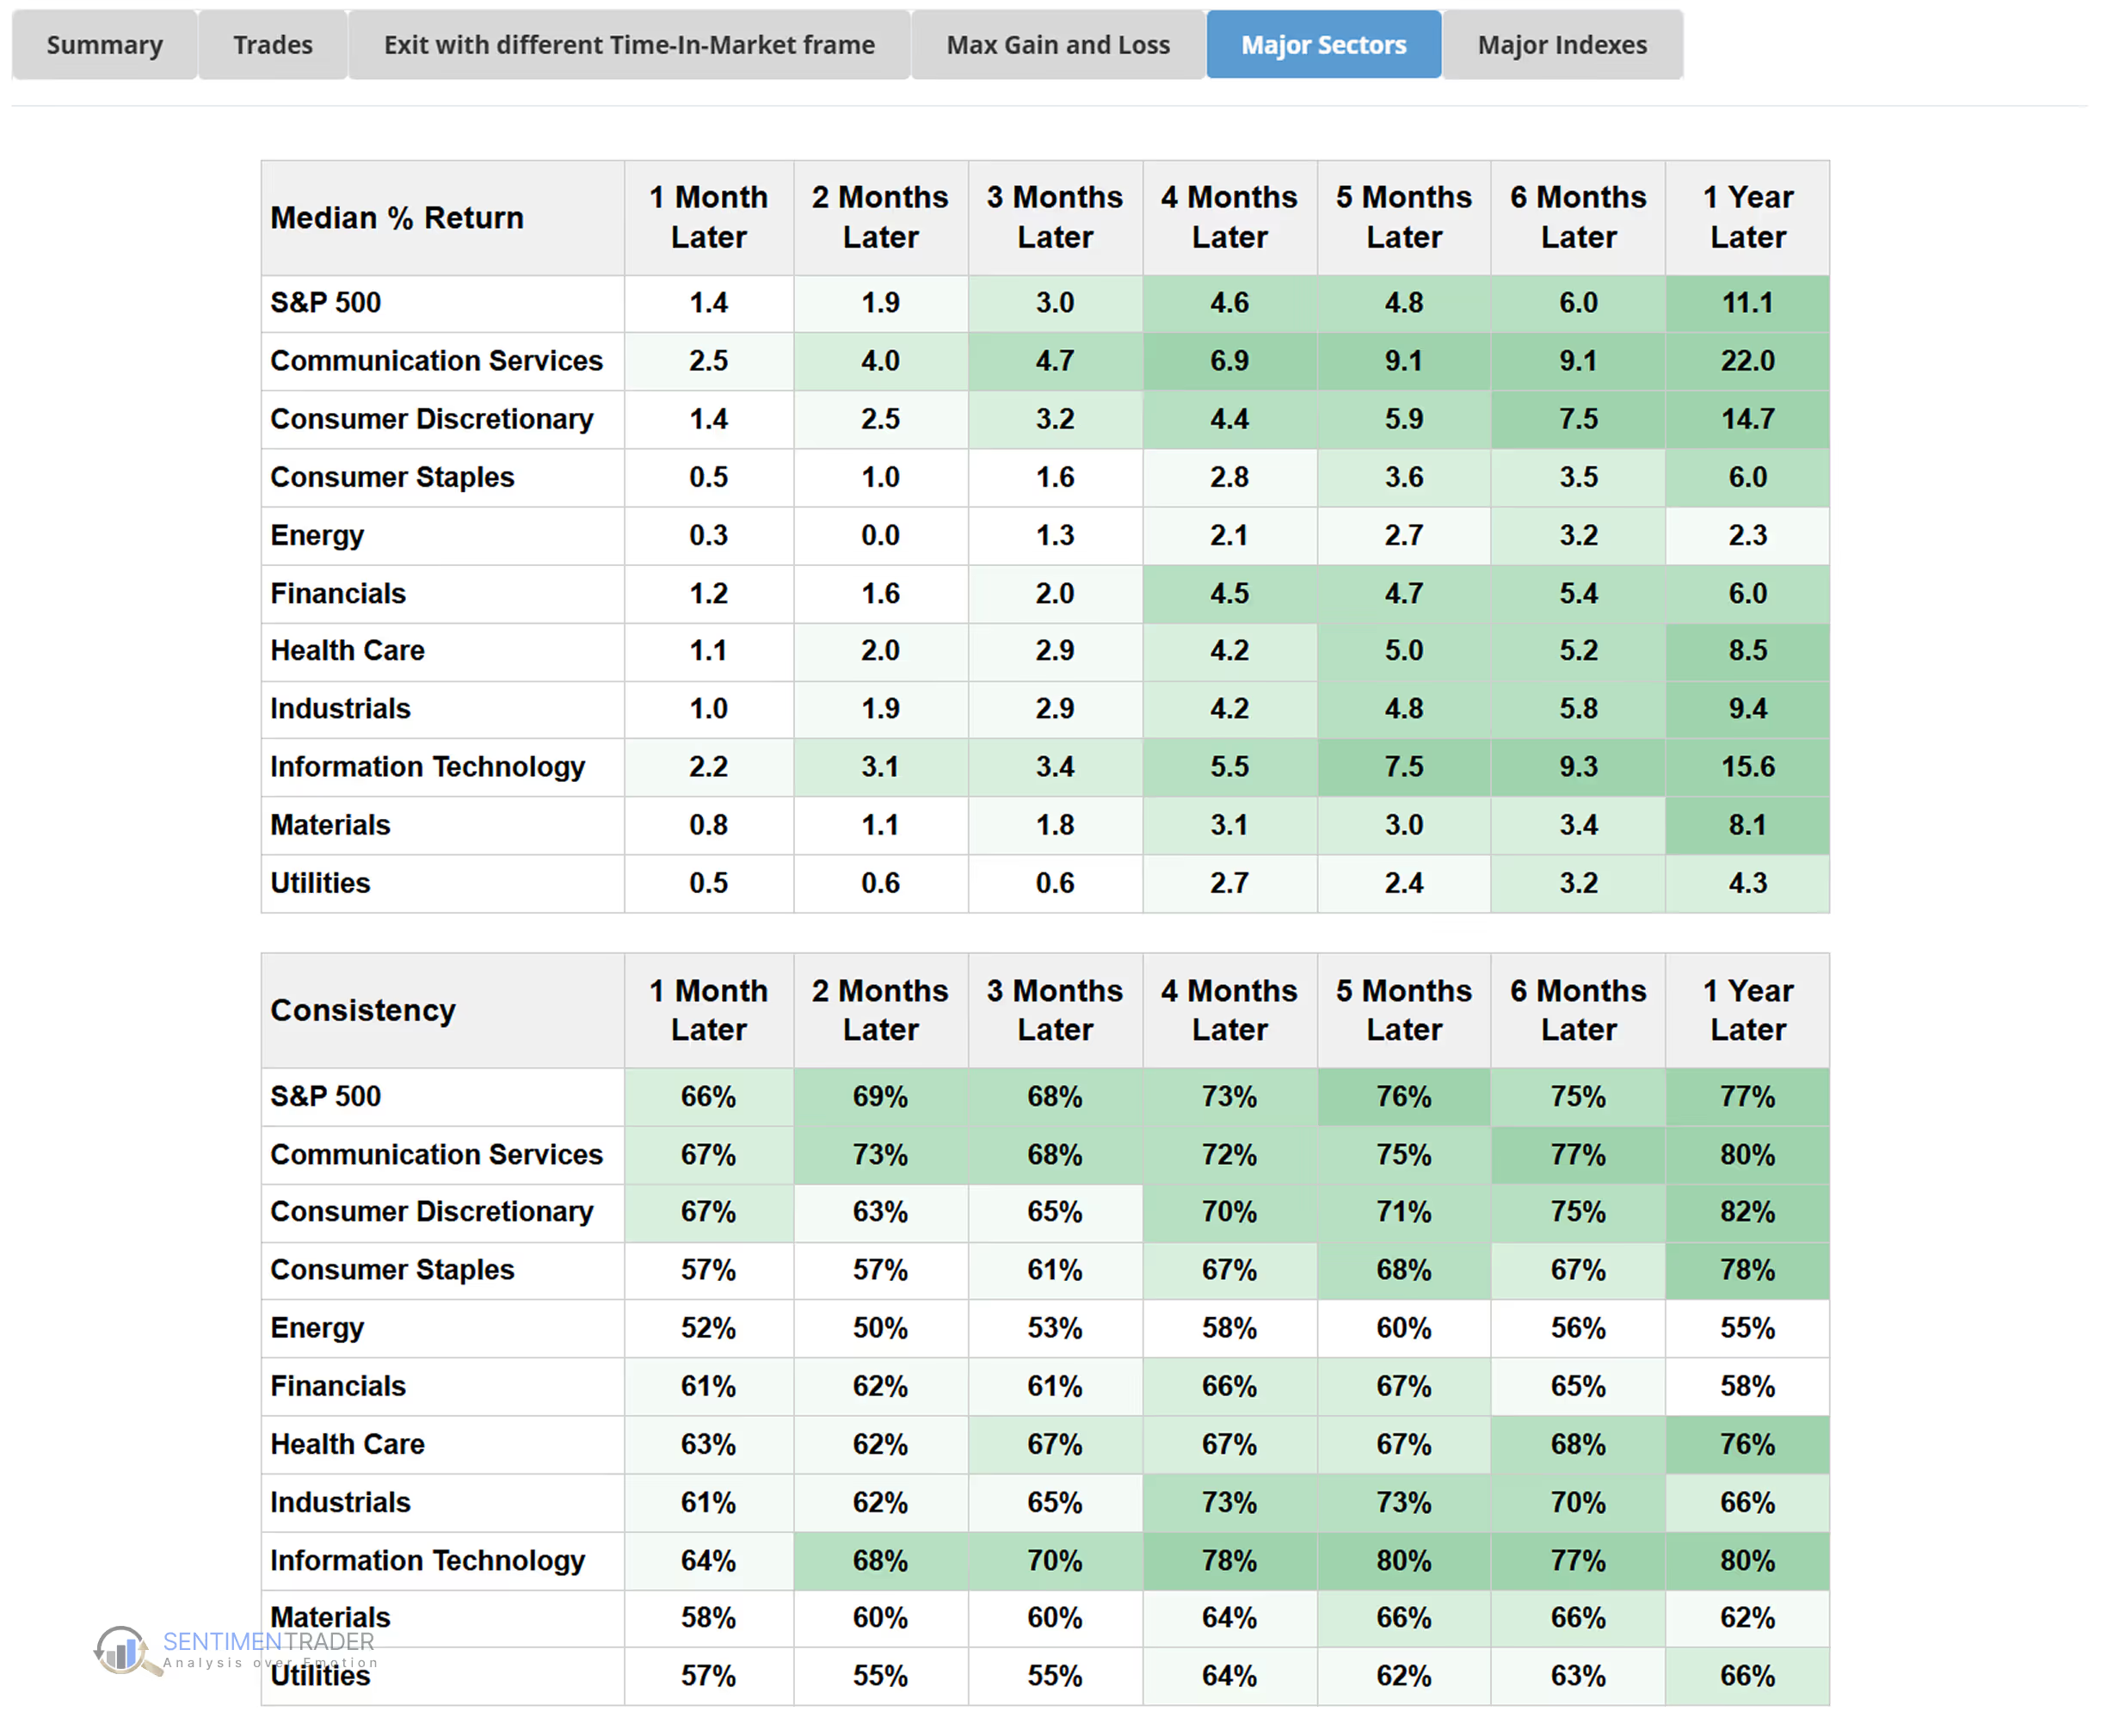
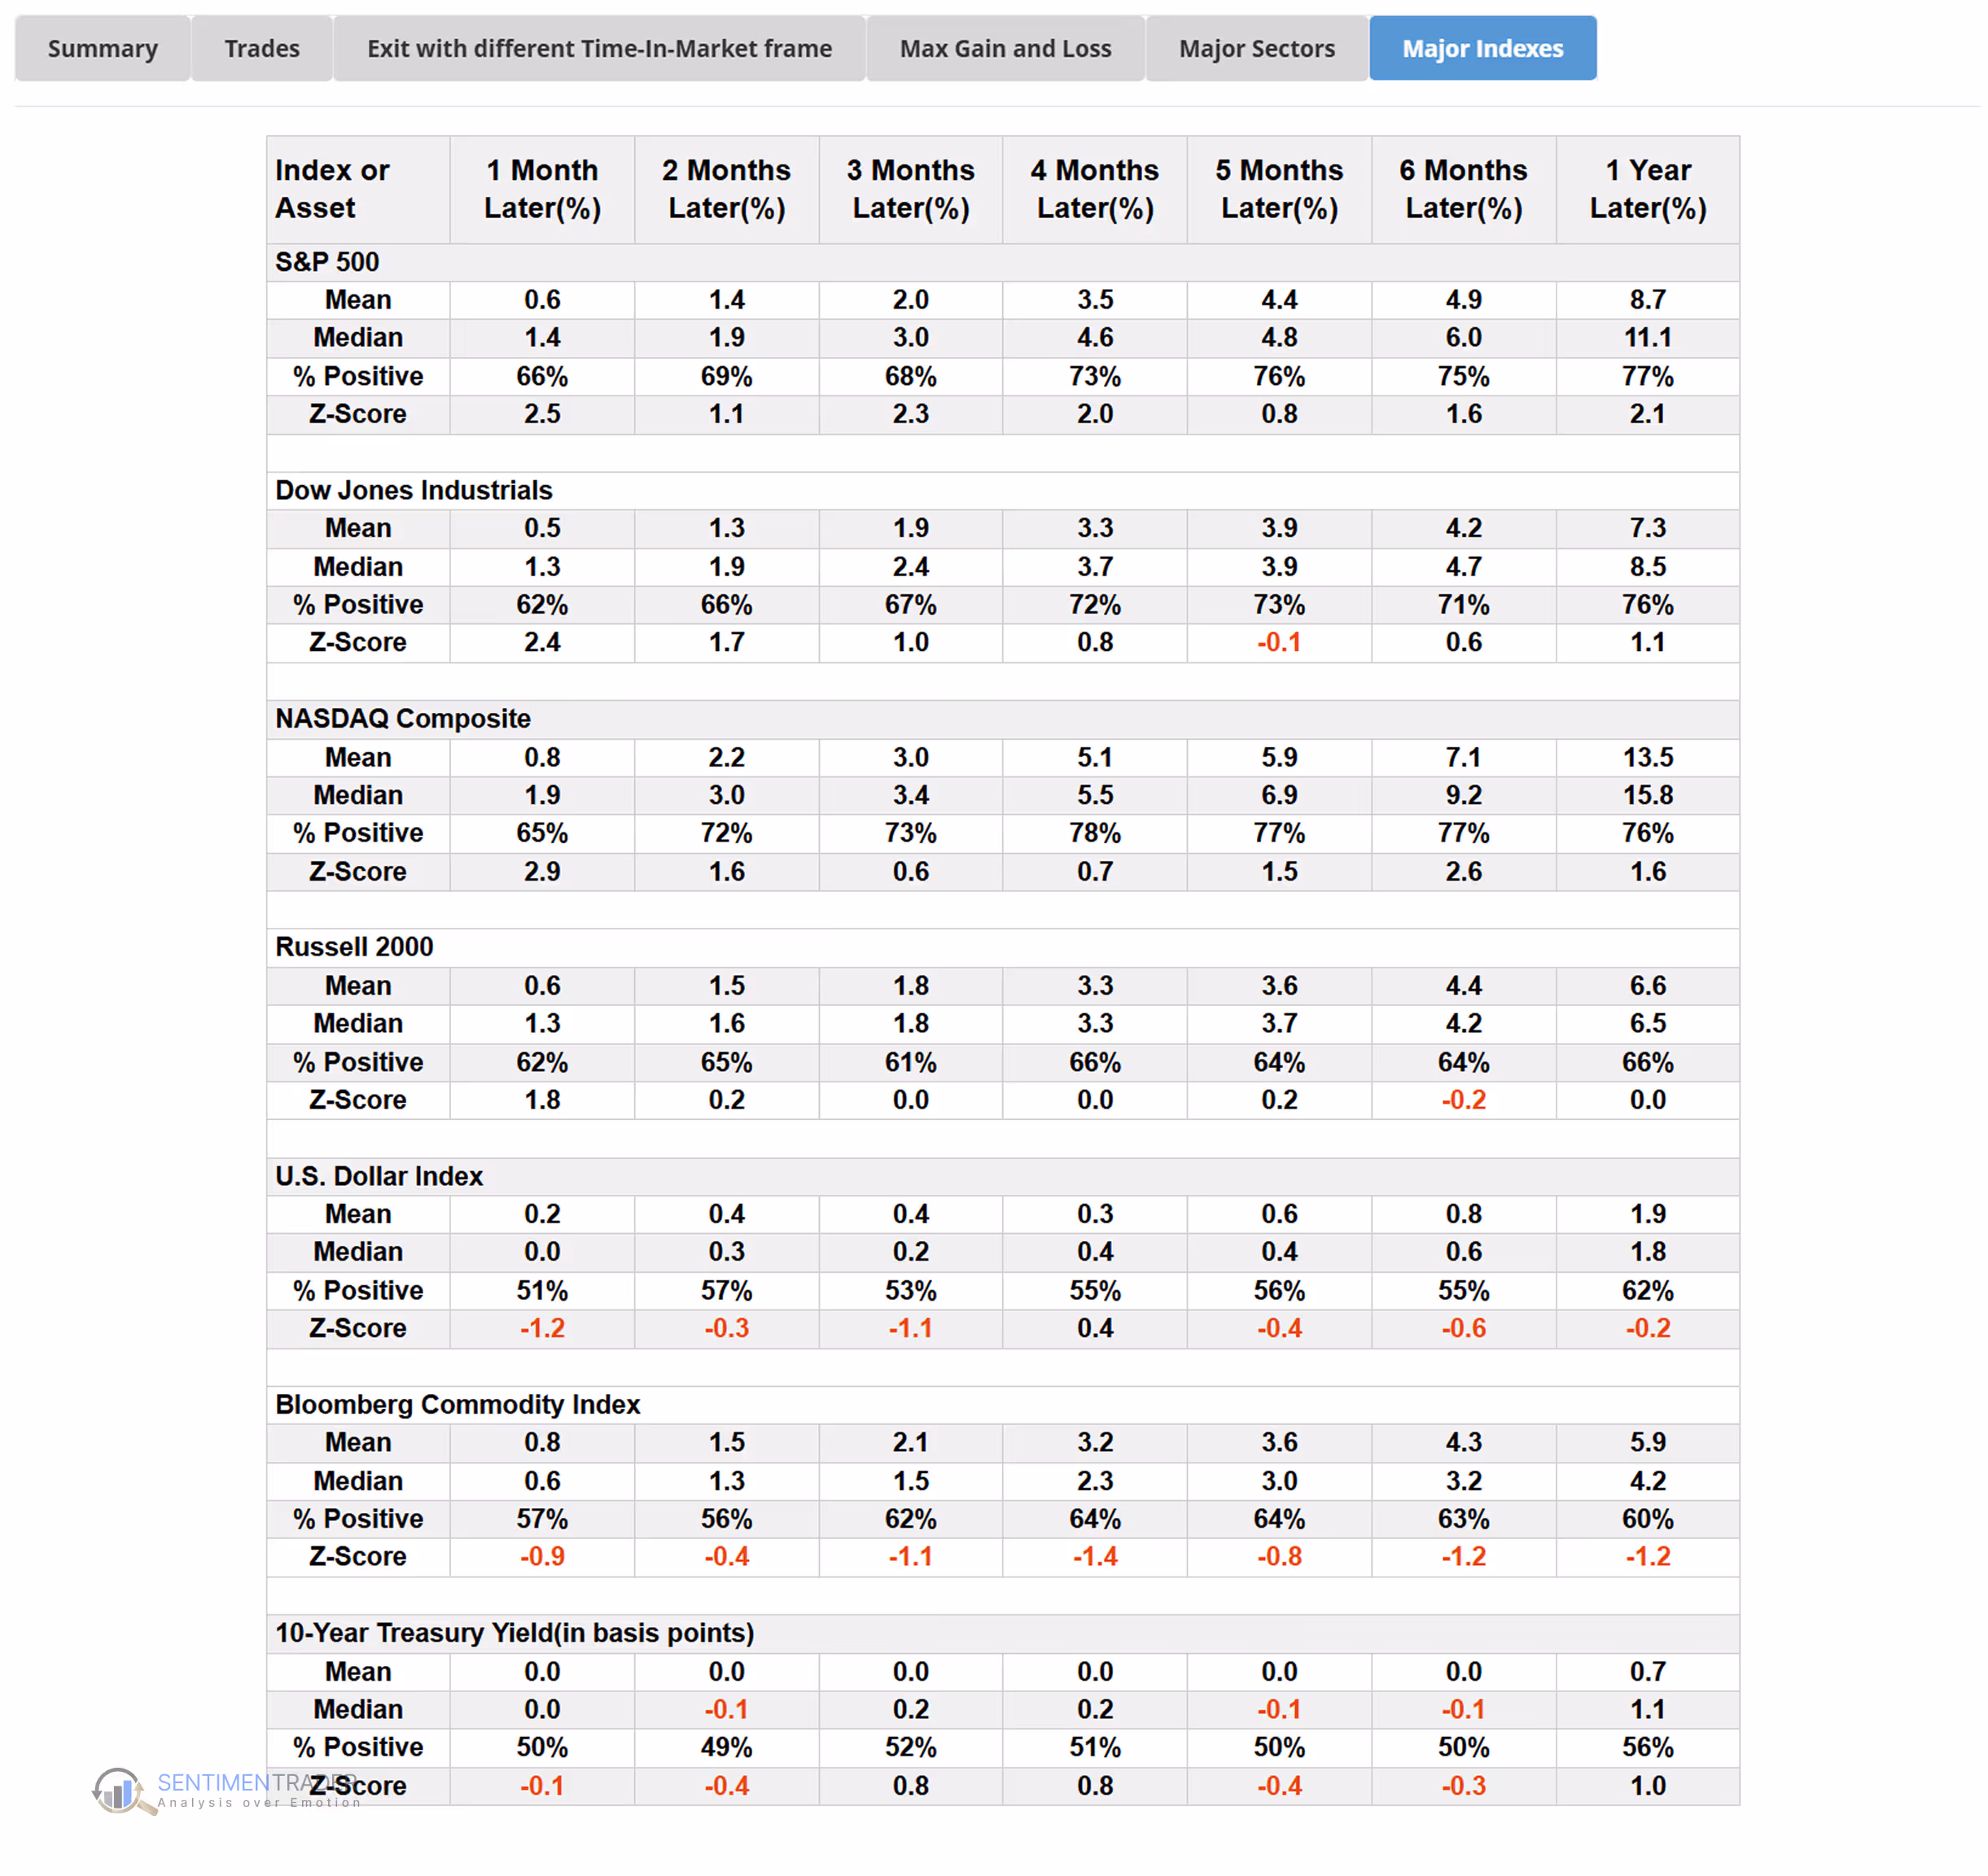
This backtest was run using SentimenTrader's Proprietary Backtest Engine, which lets you test your strategy with nearly 100 technical indicators and over 17,000 indicators covering Sentiment, Trend Score, Breadth, Macro, and Seasonality. No coding required.
The Technical Bit
ADX/DMS is built from three components:
+DI (Positive Directional Indicator): Measures upward pressure.
–DI (Negative Directional Indicator): Measures downward pressure.
ADX (Average Directional Index): Smooths the gap between +DI and –DI into a trend strength line.
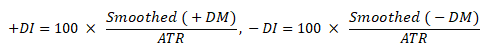
Formulas for +DI and –DI :
Where:
+DM (Positive Directional Movement) = Current High – Previous High, but only if this upward move is larger than the downward move; if not, +DM = 0. It represents upward pressure.
–DM (Negative Directional Movement) = Current Low – Previous Low, but only if this downward move is larger than the upward move; if not, –DM = 0. It represents downward pressure.
ATR (Average True Range): A volatility measure that averages recent price ranges. Here, it is used to normalize +DM and –DM into percentages.
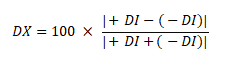
Once +DI and –DI are derived, we can now proceed to calculate the Average Directional Index (ADX).
The ADX is formed by smoothing a measure called the Directional Index (DX) over the chosen period (commonly 14). To compute DX, we measure the relative gap between +DI and –DI:
ADX ranges from 0 to 100 and is non-directional—it rises when a trend (up or down) strengthens and falls as it weakens.
Quick note on smoothing: Wilder’s smoothing (a moving-average method similar in spirit to an EMA) calms the jagged DX so ADX is steadier and more readable.
Common settings and tweaks
Default setting: 14 periods, widely used across markets.
Shorter settings (e.g., 7–10): more sensitive, react faster, but may generate more false signals.
Longer settings (e.g., 20–30): smoother, filter out noise, but may respond too slowly to new trends.
What This Means for Traders
ADX/DMS won’t predict the future. It is a trend indicator that helps answer two key questions:
Is the market trending, or just chopping sideways?
If trending, is the strength enough to matter?
The +DI and –DI lines reveal directional pressure, while ADX measures whether that pressure is significant. Because ADX is based on past data, it lags and can produce false signals in choppy conditions.
That’s why many traders combine ADX/DMS with indicators from other categories—Momentum tools like RSI to confirm strength, Volume measures like On-Balance Volume to gauge participation, or Volatility tools like Bollinger Bands to test if a breakout can hold.
Used together, these tools provide a fuller perspective and help traders manage risk more effectively.