Why the Fear & Greed Model Matters
Investor psychology often drives short- to medium-term market movements before fundamentals or technicals confirm them.
The Fear & Greed Model captures those emotional swings in a quantifiable way — showing when risk appetite or risk aversion reaches unsustainable levels.
Clarity: Distills complex behavioral inputs into one composite sentiment gauge ranging from extreme fear to extreme greed.
Context: Reflects how crowd emotion interacts with price trends, volatility, and credit markets.
Insight: Reveals when sentiment excess — in either direction — may set the stage for a reversal.
How Traders Use the Fear & Greed Model
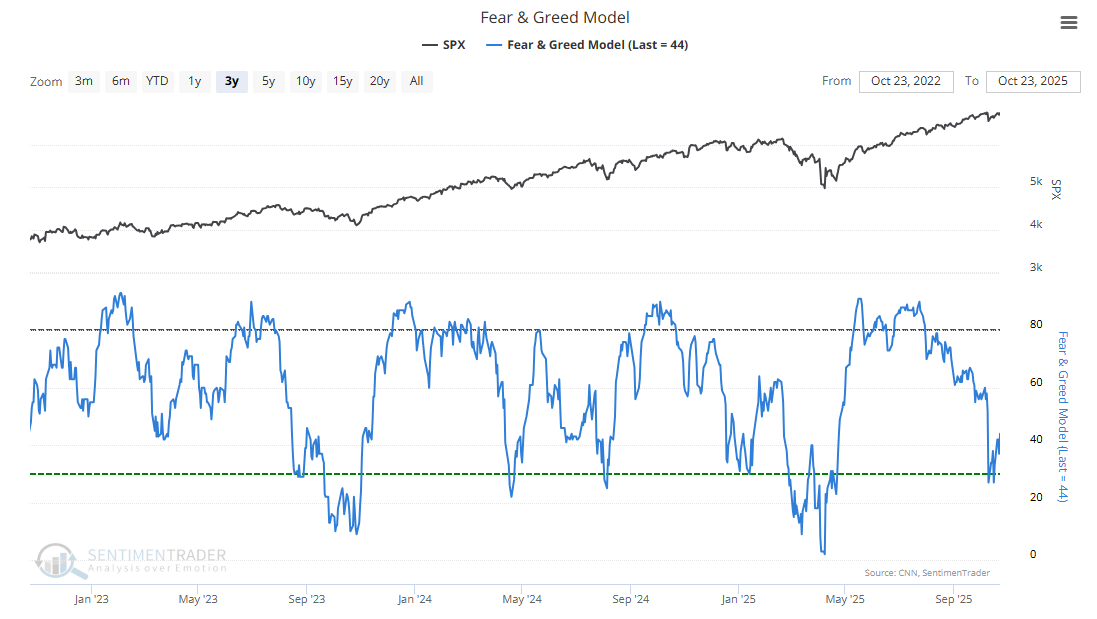
Extreme Fear (< 25): Indicates capitulation and panic — historically a contrarian opportunity, as future returns tend to be above average when investors are fearful.
Extreme Greed (> 75): Suggests widespread complacency — often preceding slower gains or corrections as optimism peaks.
Neutral Zone (25–75): Reflects balance between fear and greed, typically aligning with trend continuation periods.
Behavioral Cycles: Traders monitor how fast the model transitions between zones to gauge emotional momentum and potential exhaustion points.
The Technical Bit
Calculation and components
The Fear & Greed Model aggregates several sentiment drivers, each reflecting a different behavioral or risk dimension, and is based on CNN’s original framework but uses SentimenTrader’s own inputs — including refined put/call and junk bond measures — to better capture current market behavior.
1. Price Momentum – Compares the S&P 500 to its 125-day average to measure trend strength.
2. Stock Price Breadth – Evaluates how many stocks participate in the advance or decline.
3. Volatility Index (VIX) – Captures fear through option-implied volatility levels.
4. Put/Call Ratio – Gauges speculative positioning in the options market.
5. Safe-Haven Demand – Analyzes stock-versus-bond relative performance.
6. Junk Bond Demand – Measures risk appetite in the credit market.
7. Market Breadth and Volume Indicators – Confirm whether optimism or fear is supported by participation.
The composite value typically ranges from 0 (extreme fear) to 100 (extreme greed).
Readings below 25 → panic and risk aversion.
Readings above 75 → exuberance and complacency.
Mid-range values (~50) → balanced market psychology.
What This Means for Traders
The Fear & Greed Model helps visualize the market’s emotional cycle — from panic to euphoria. It’s not a timing tool on its own, but rather a sentiment context indicator that adds psychological depth to price and fundamental analysis.
Since crowd emotions can remain extreme for extended periods, it works best when combined with trend or momentum indicators that confirm whether price action supports or contradicts sentiment.
This is a proprietary SentimenTrader interpretation, updated daily and available exclusively to subscribers. It can also be explored through SentimenTrader’s Proprietary Backtest Engine to quantify how shifts between fear and greed have historically influenced market outcomes.