Why STARC Bands Matters
Markets rarely move in straight lines — volatility creates swings where price stretches too far in one direction. STARC Bands visualize those stretches by combining trend and volatility into one framework.
Clarity: Show when prices have moved unusually far from their short-term average.
Risk Awareness: Highlight zones where trades may carry higher or lower risk.
Adaptability: Expand and contract automatically with changing volatility, keeping signals relevant in both calm and active markets.
How Traders Use STARC Bands
Identify overextended moves: Price near the upper band suggests a stretched market and potential for pullback; near the lower band suggests an overshoot to the downside.
Frame risk and reward: Upper band = lower-risk sell area / higher-risk buy area; lower band = lower-risk buy area / higher-risk sell area.
Combine with oscillators: Tools like the Stochastic Oscillator or RSI can help confirm when price reaches an extreme within the bands.
Trade reversals or ranges: Traders often use STARC Bands to fade moves at extremes, or to recognize when volatility compression precedes expansion.
Real-World Results: Do They Actually Work?
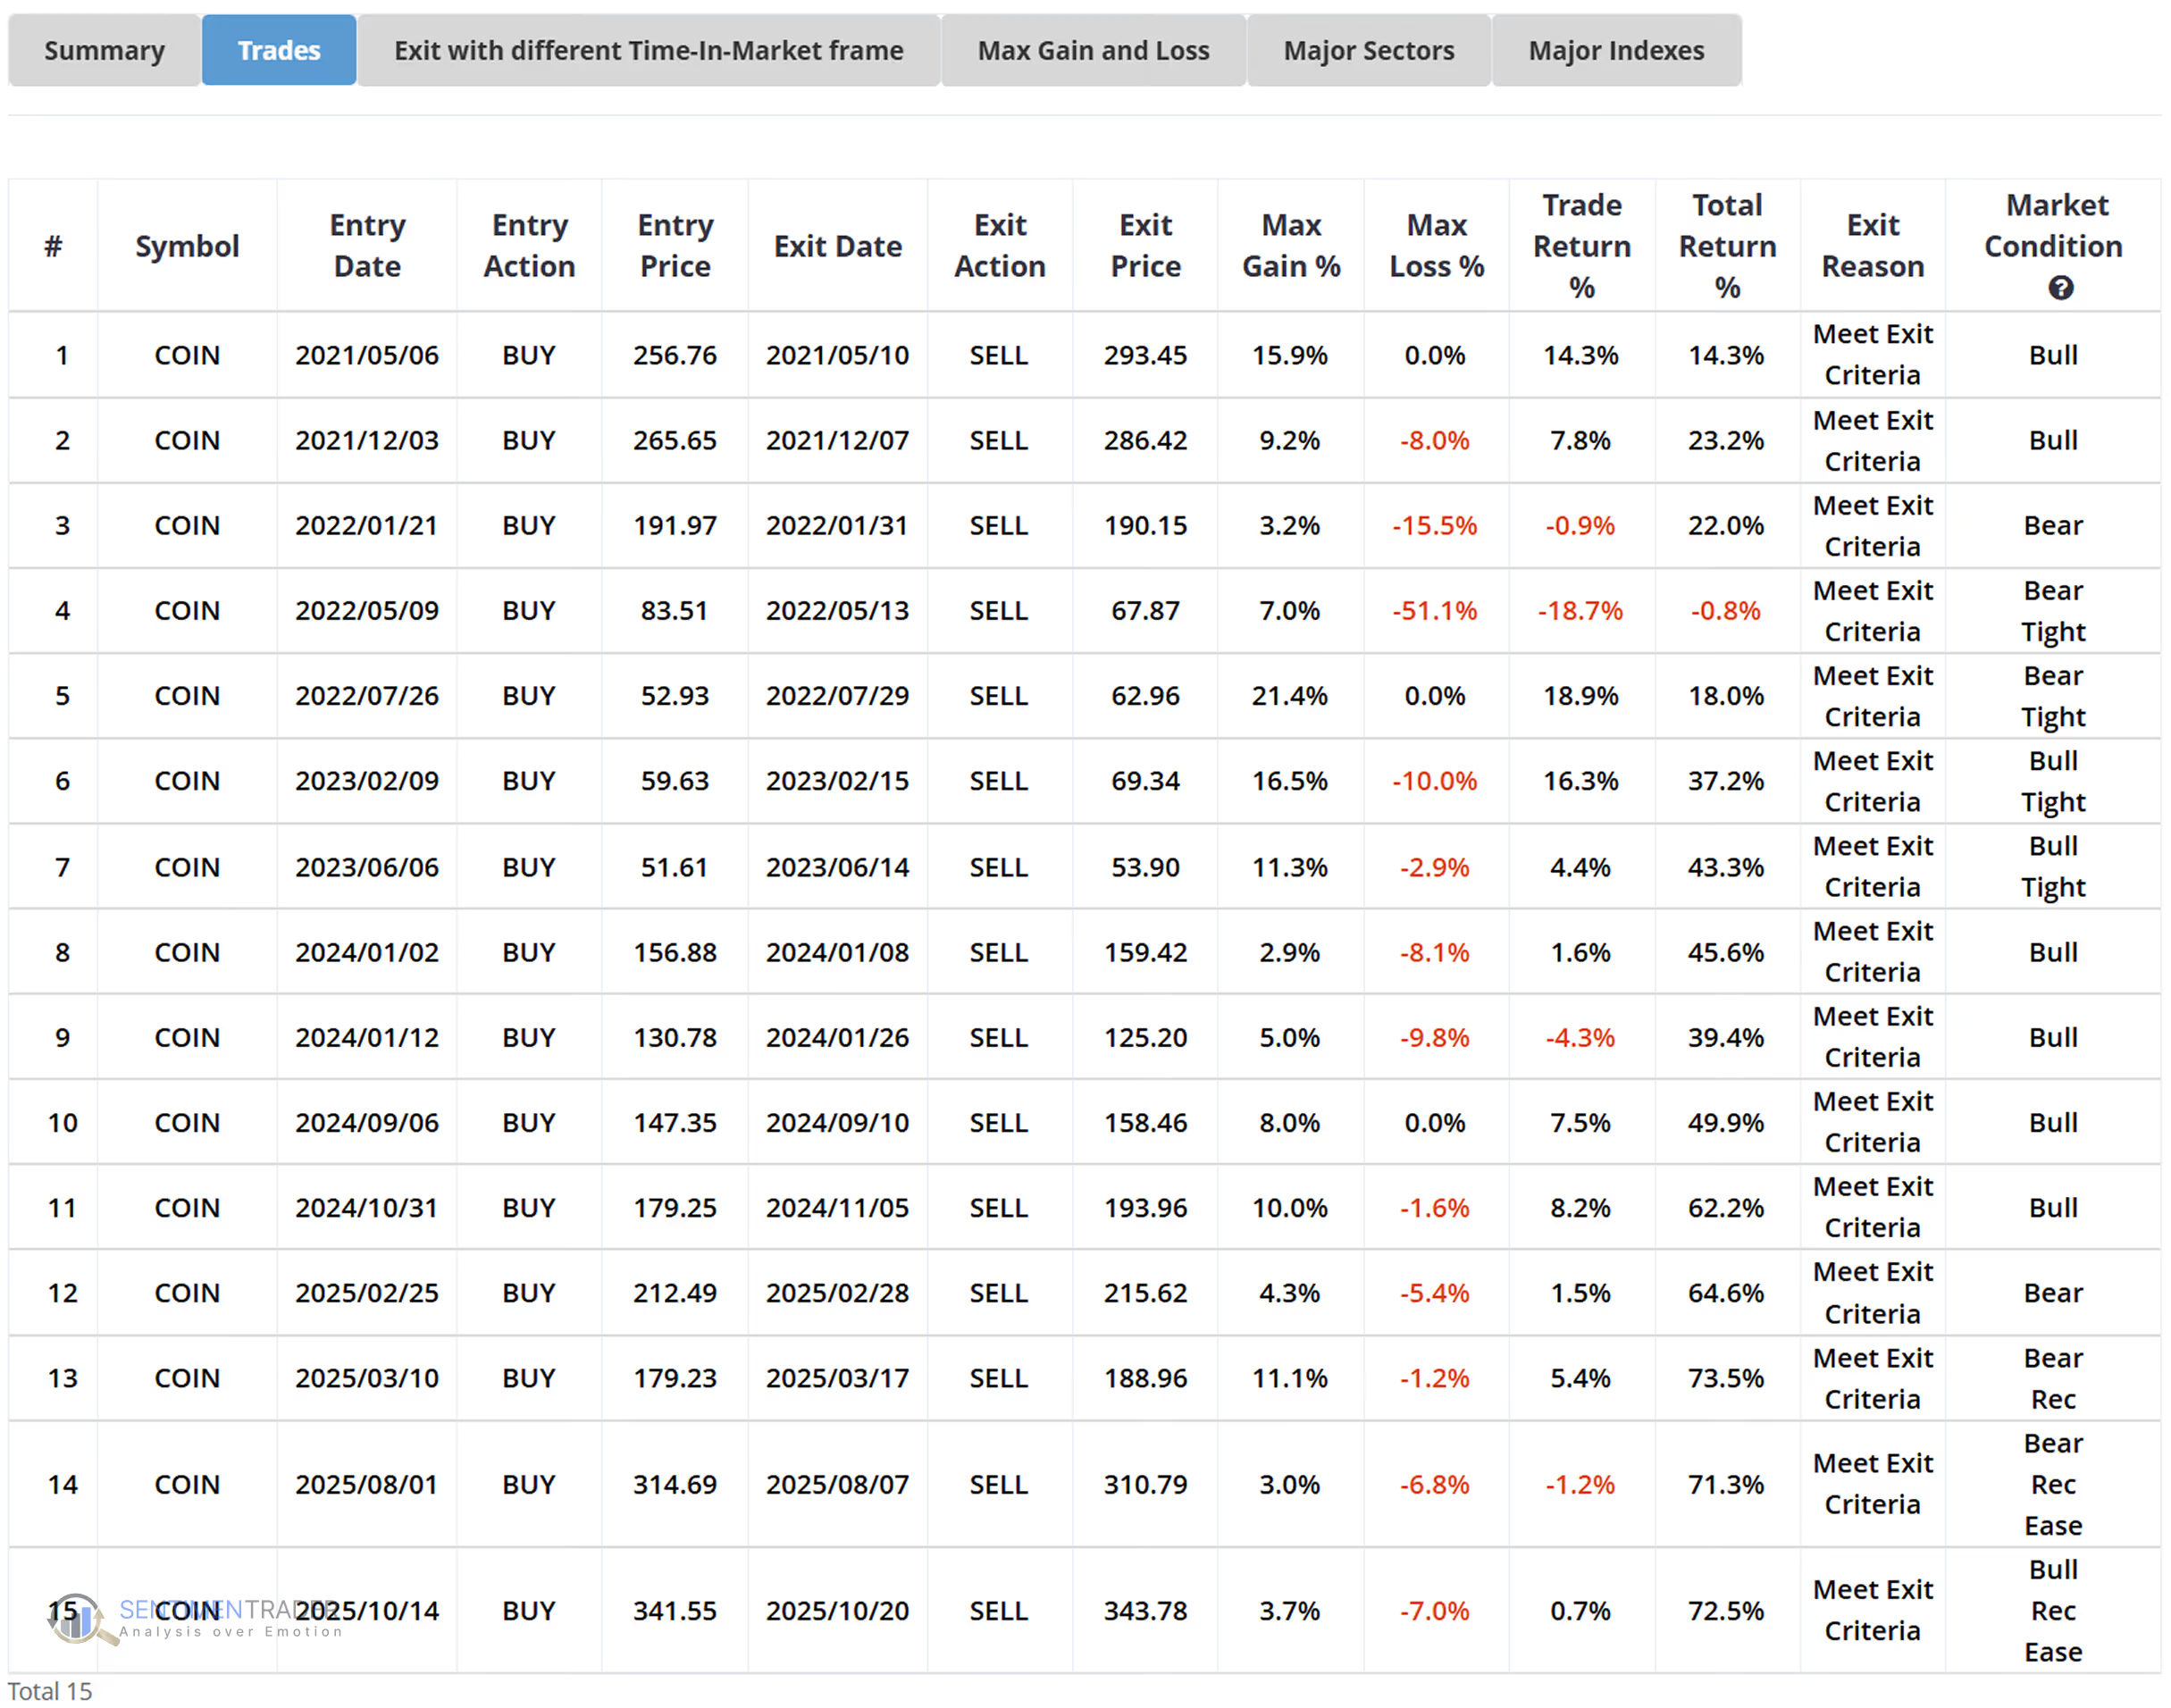
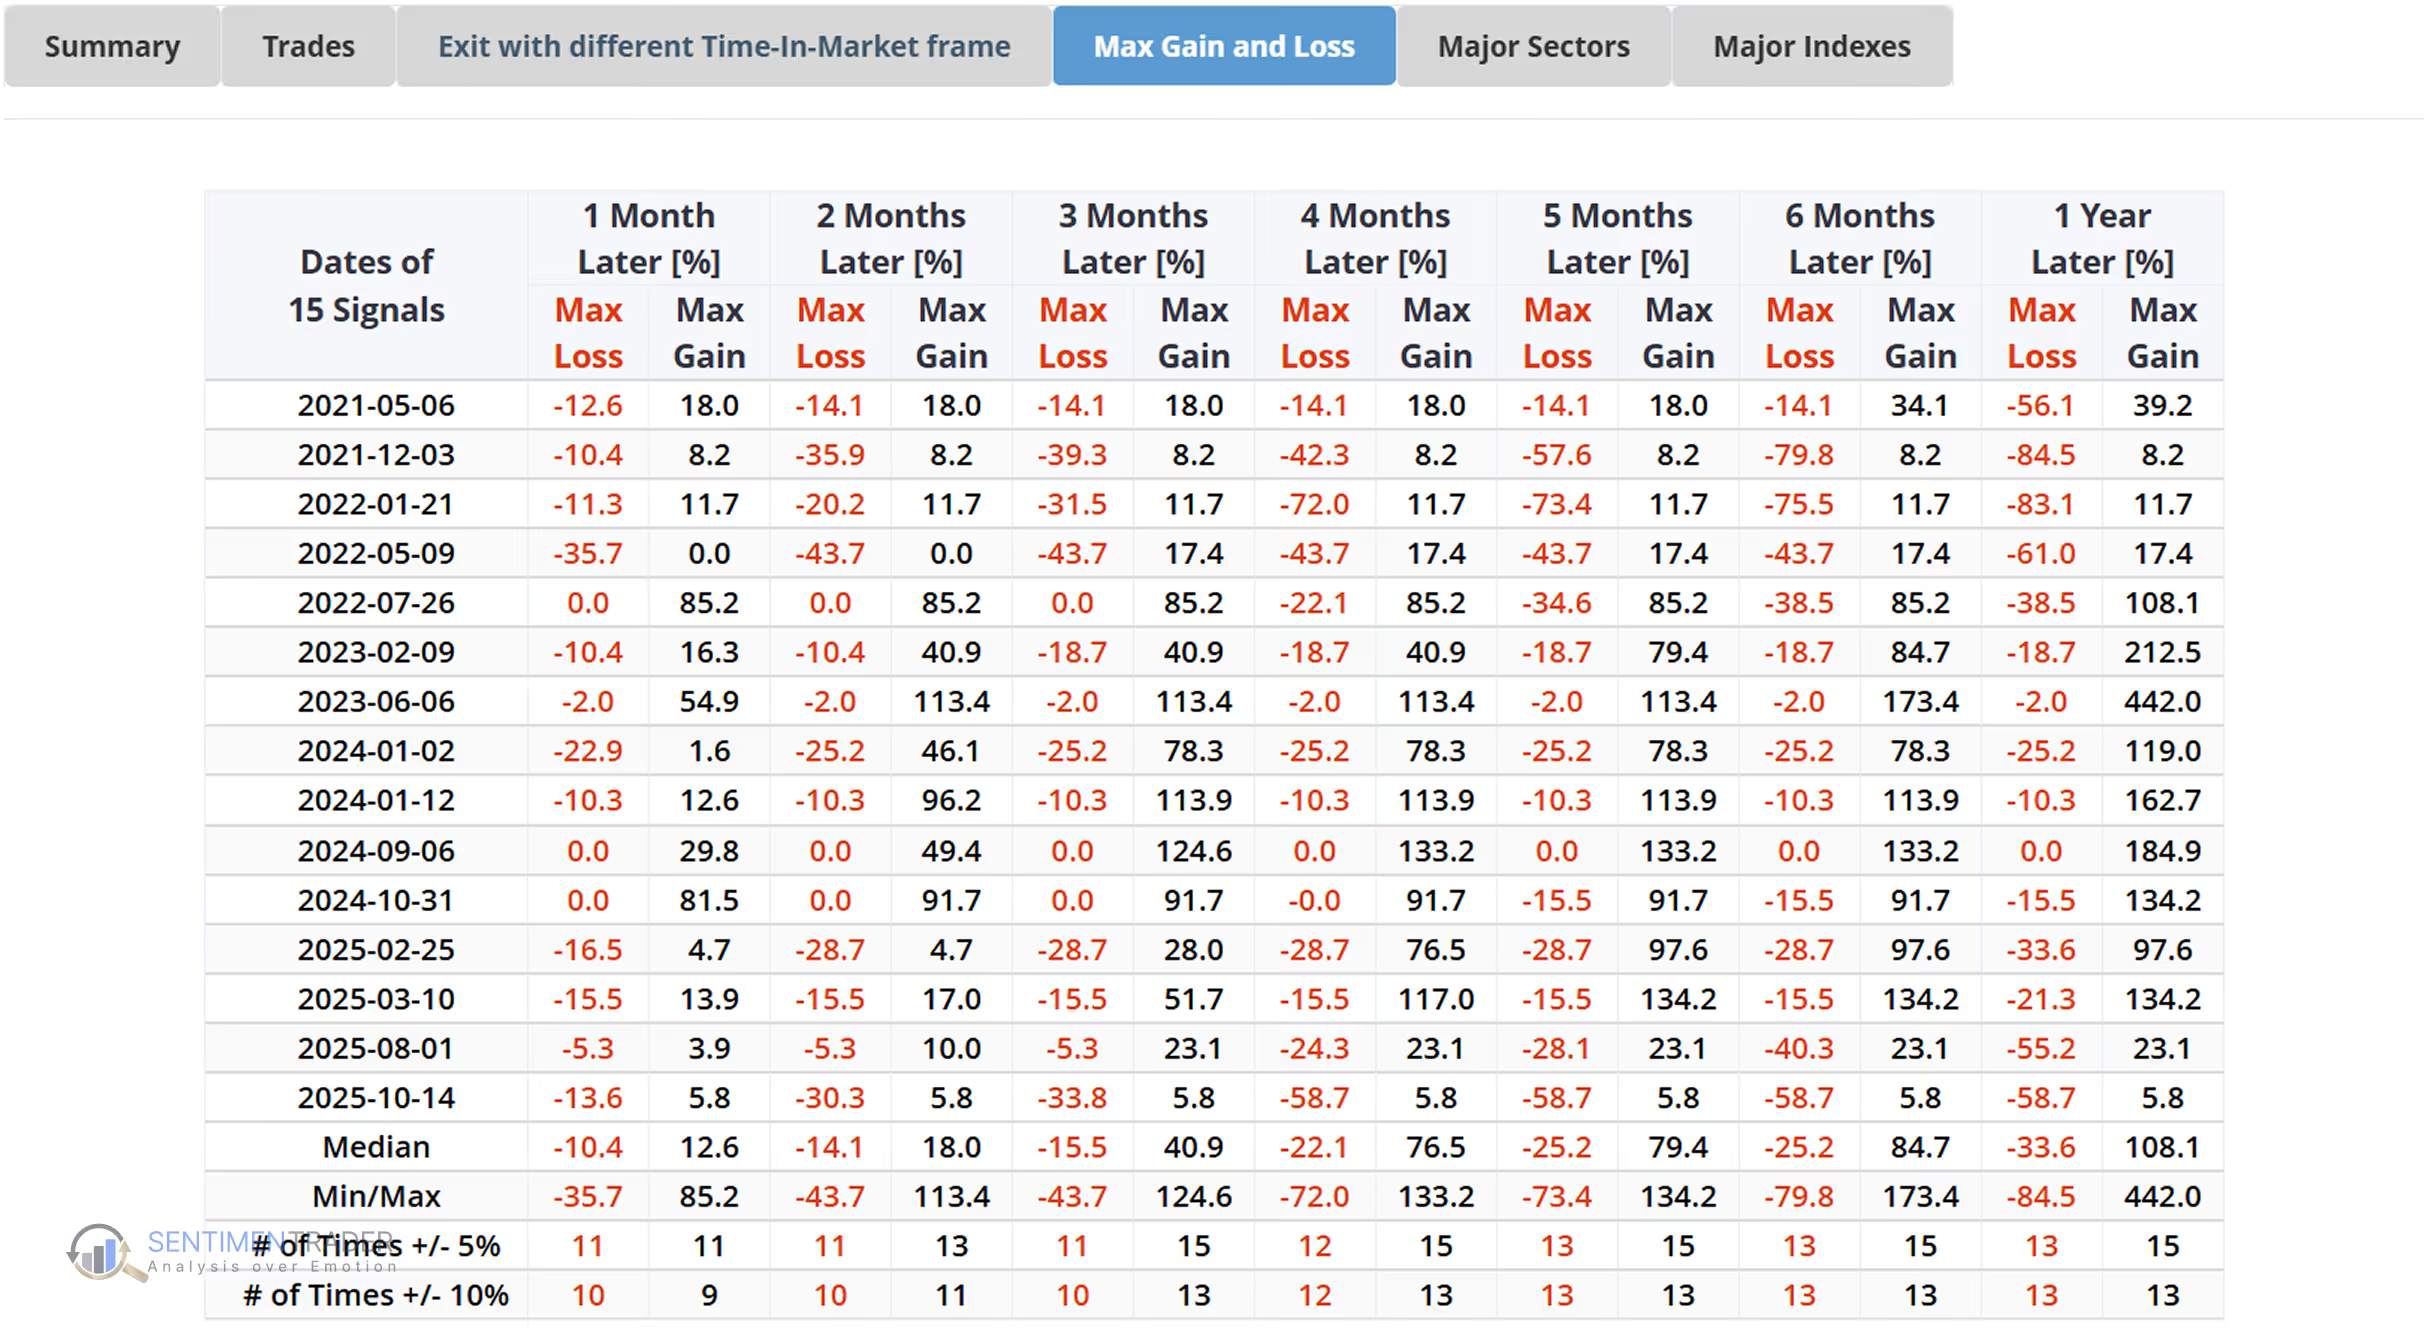
To evaluate how well STARC Bands identify volatility-driven opportunities in practice, we ran a backtest on Coinbase (COIN) using a simple mean-reversion strategy based on STARC Band extr.emes.
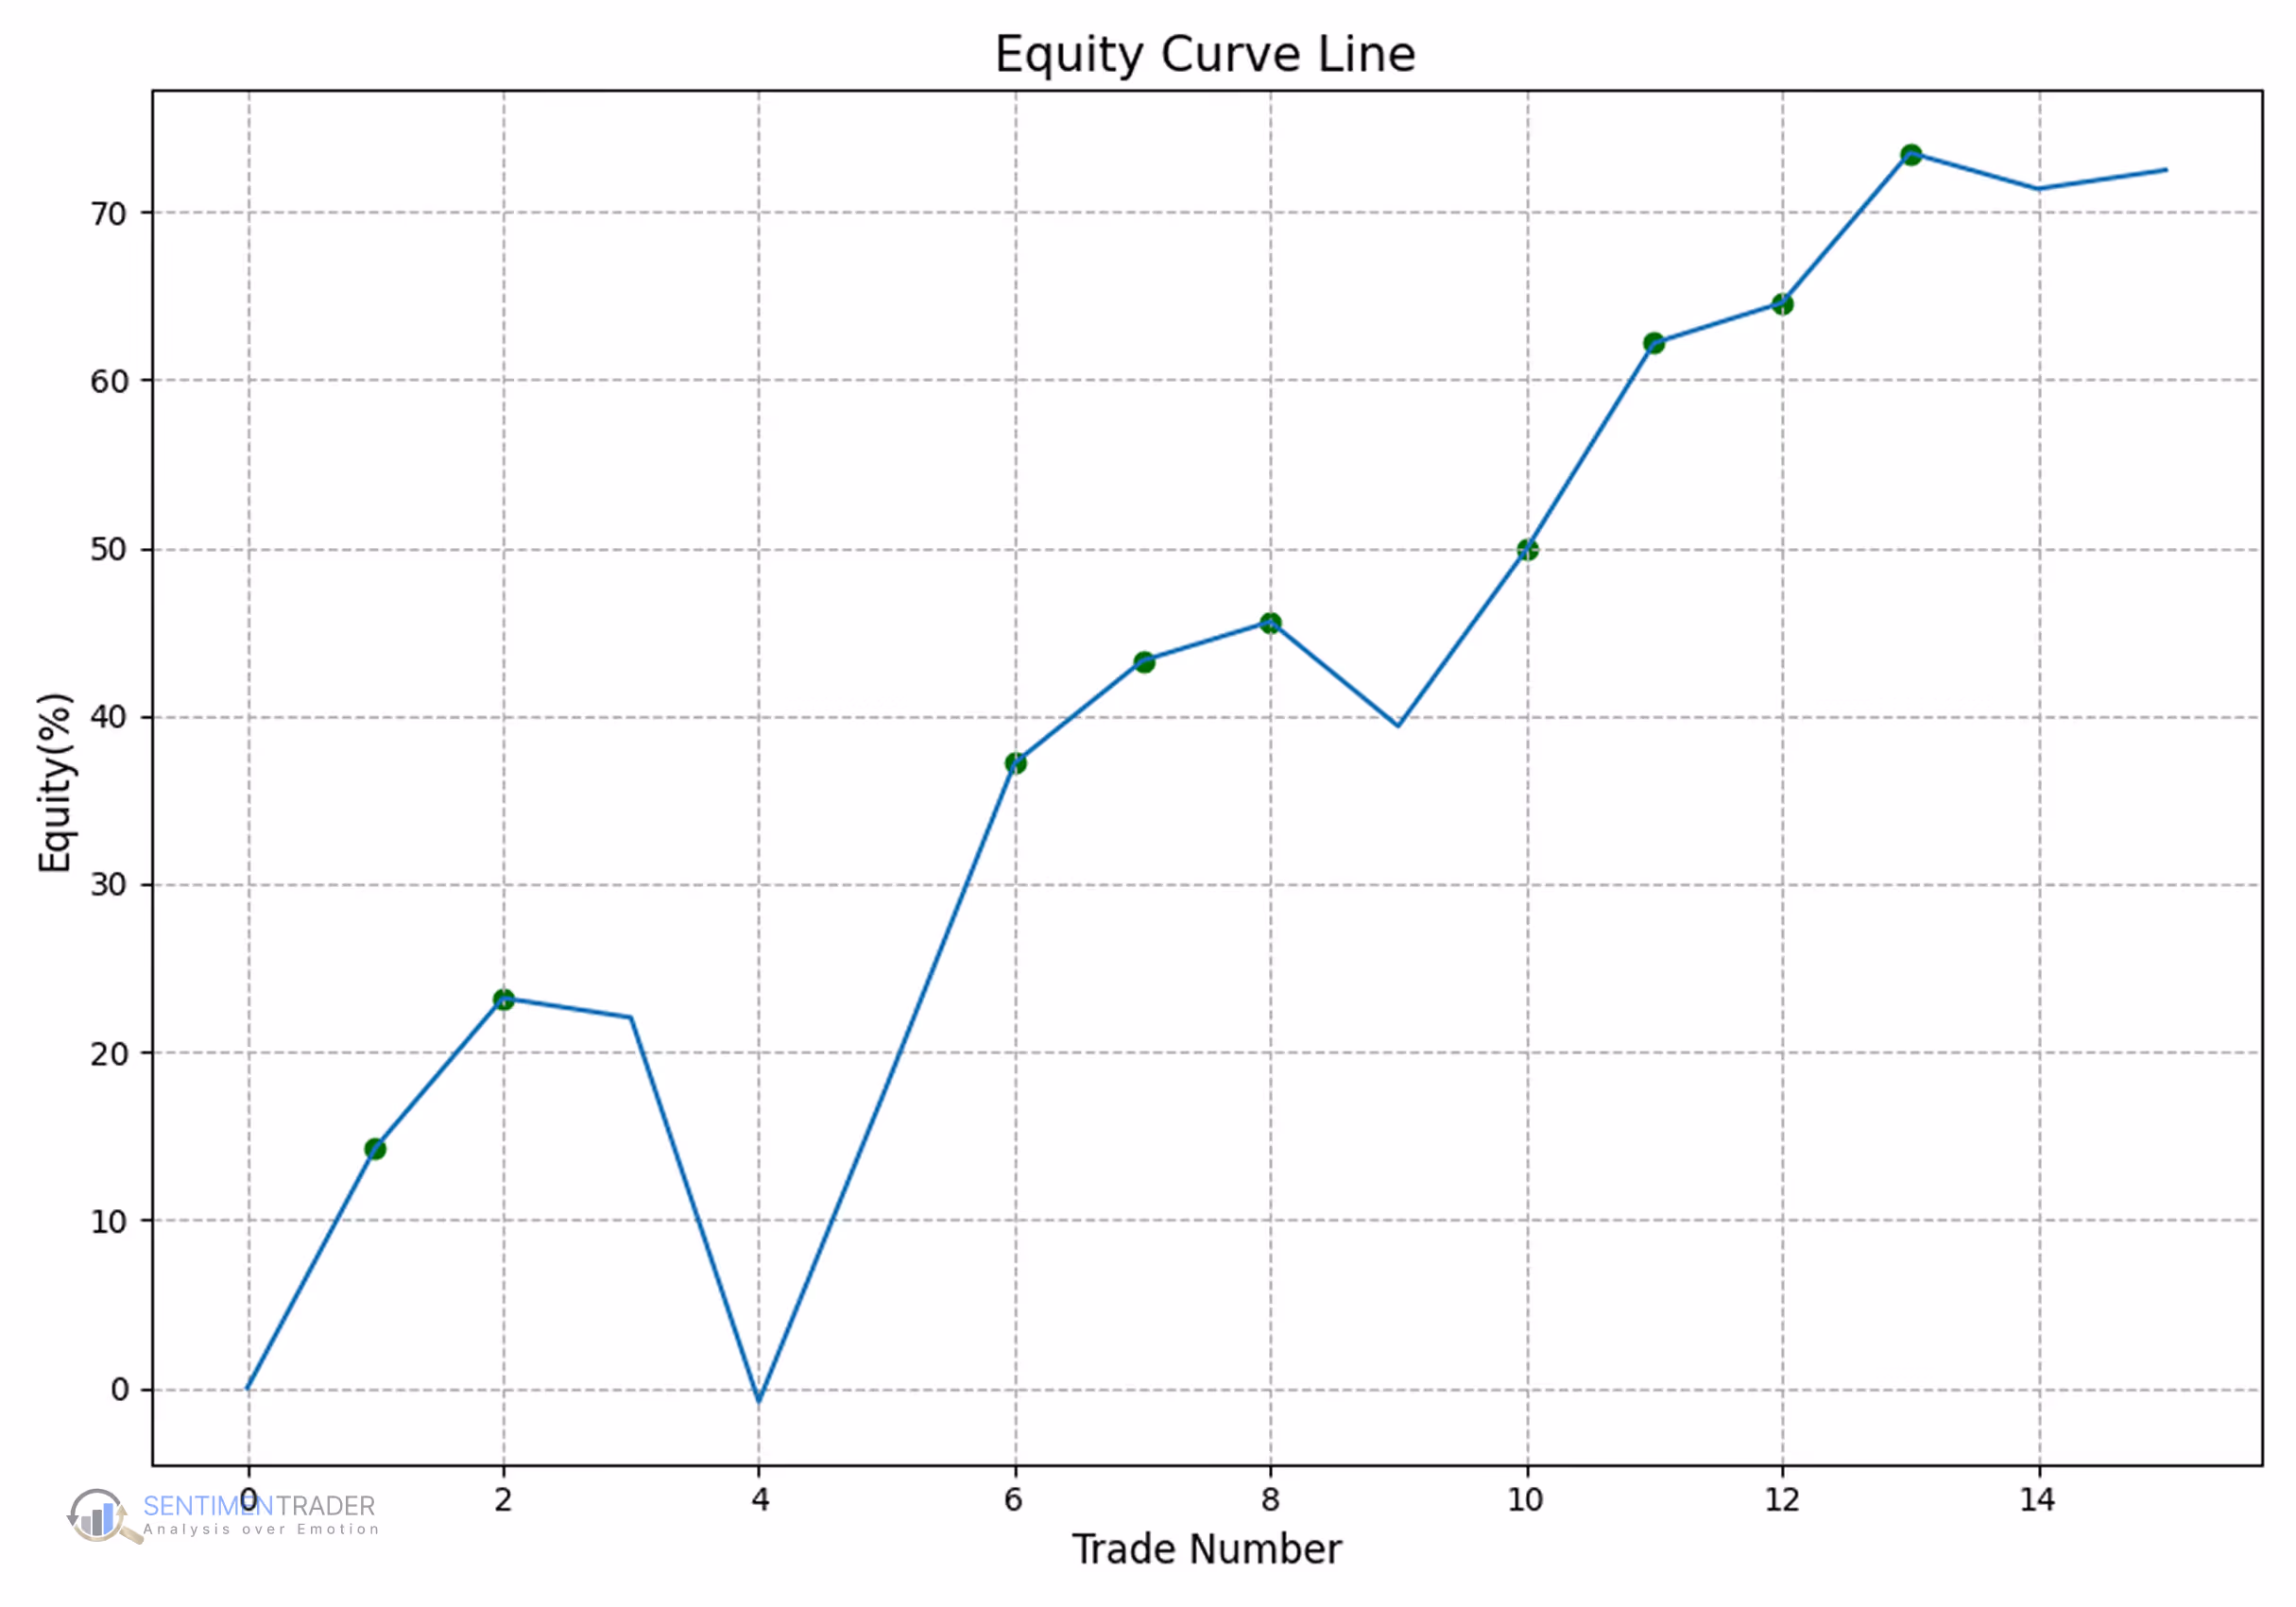
Results over 10 years:
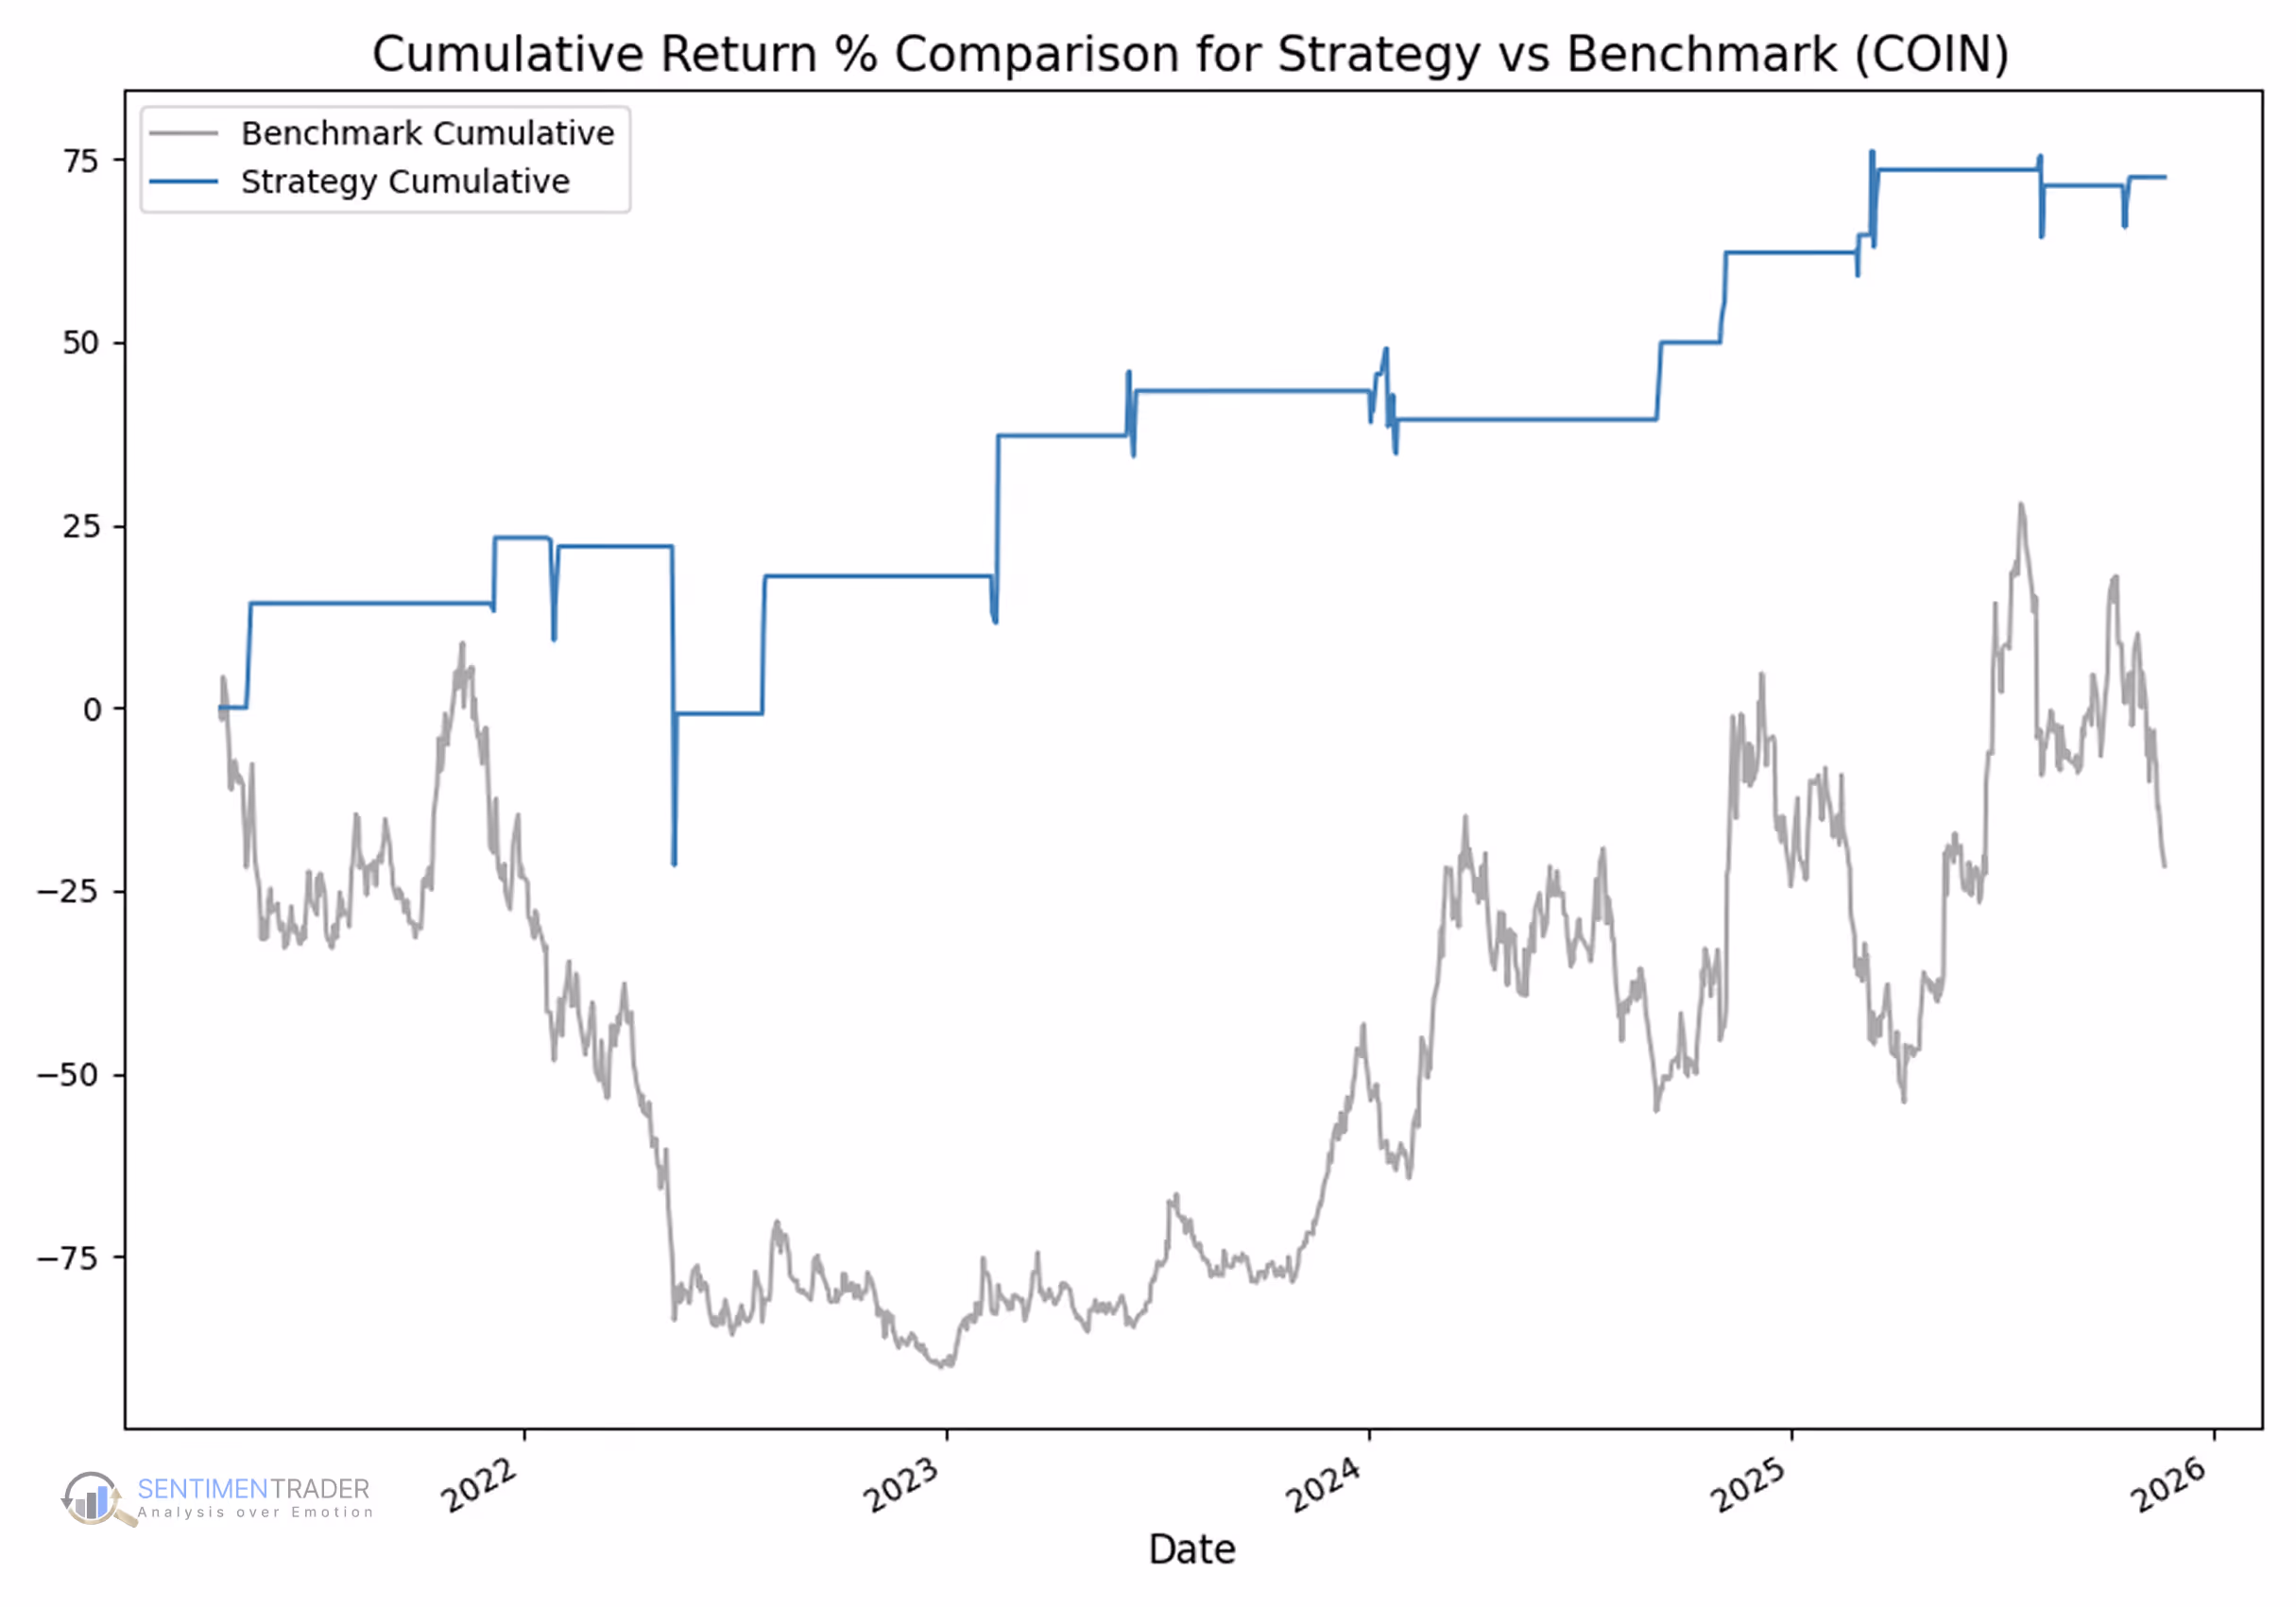
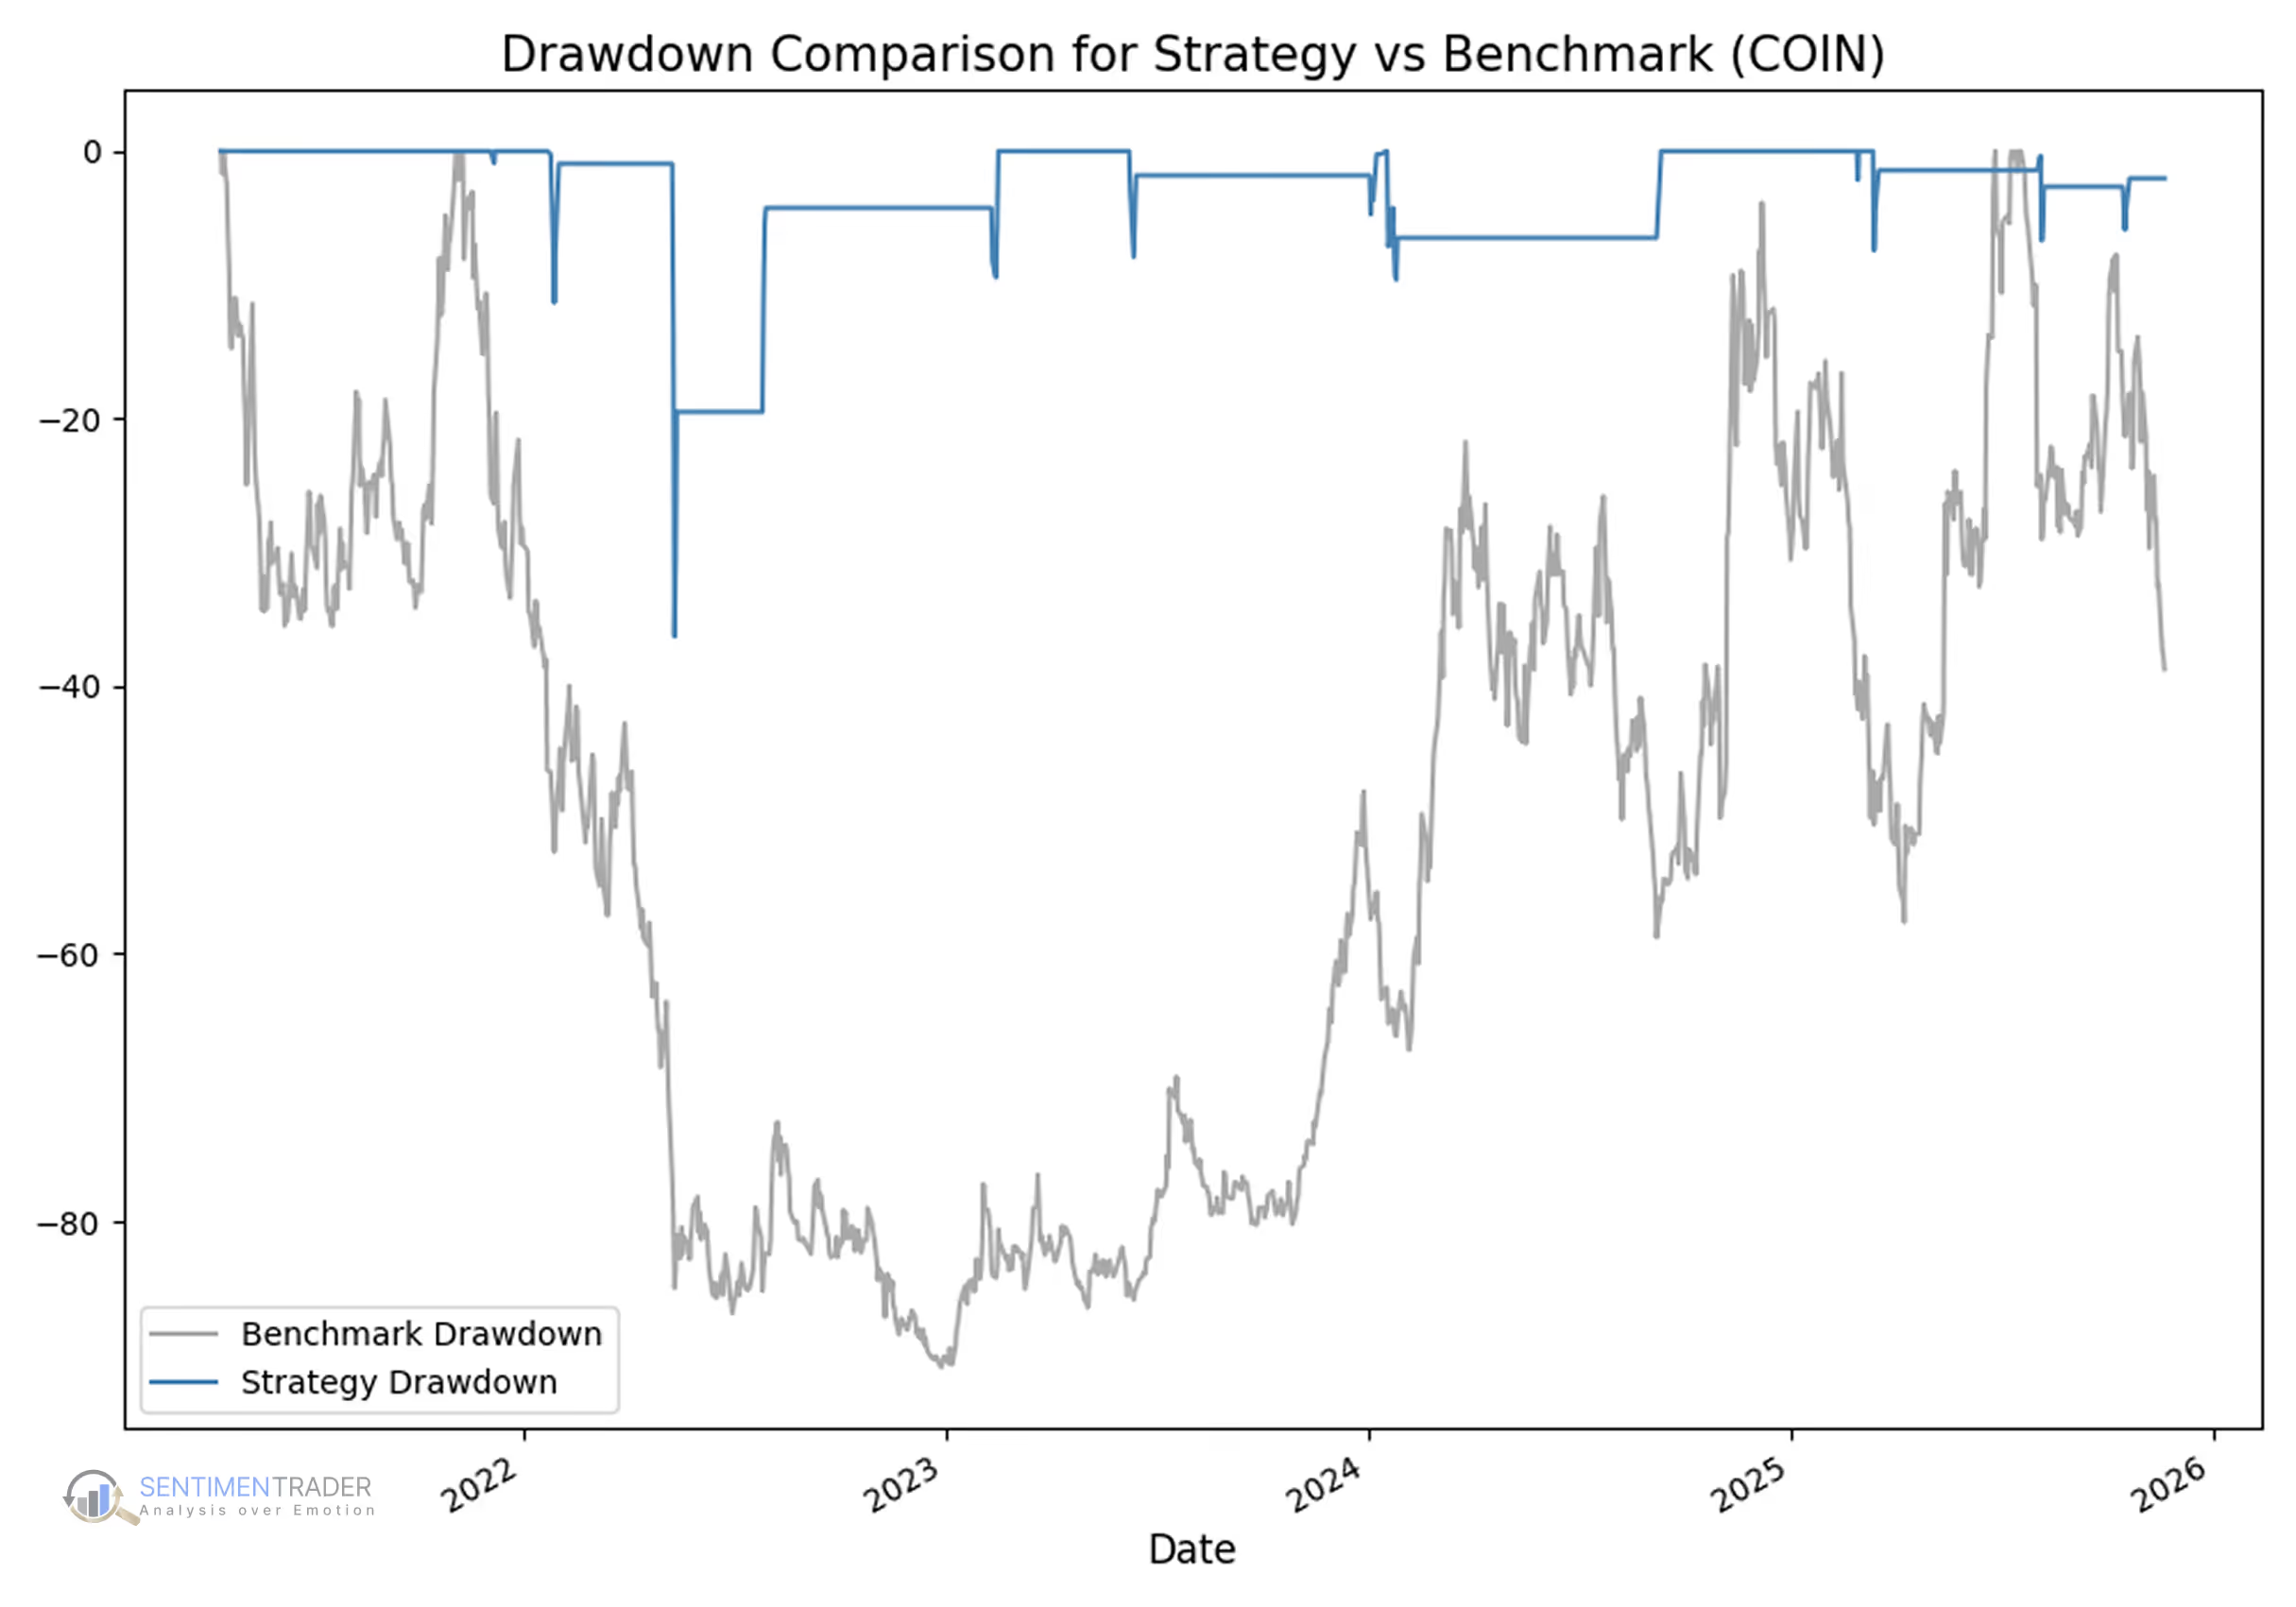
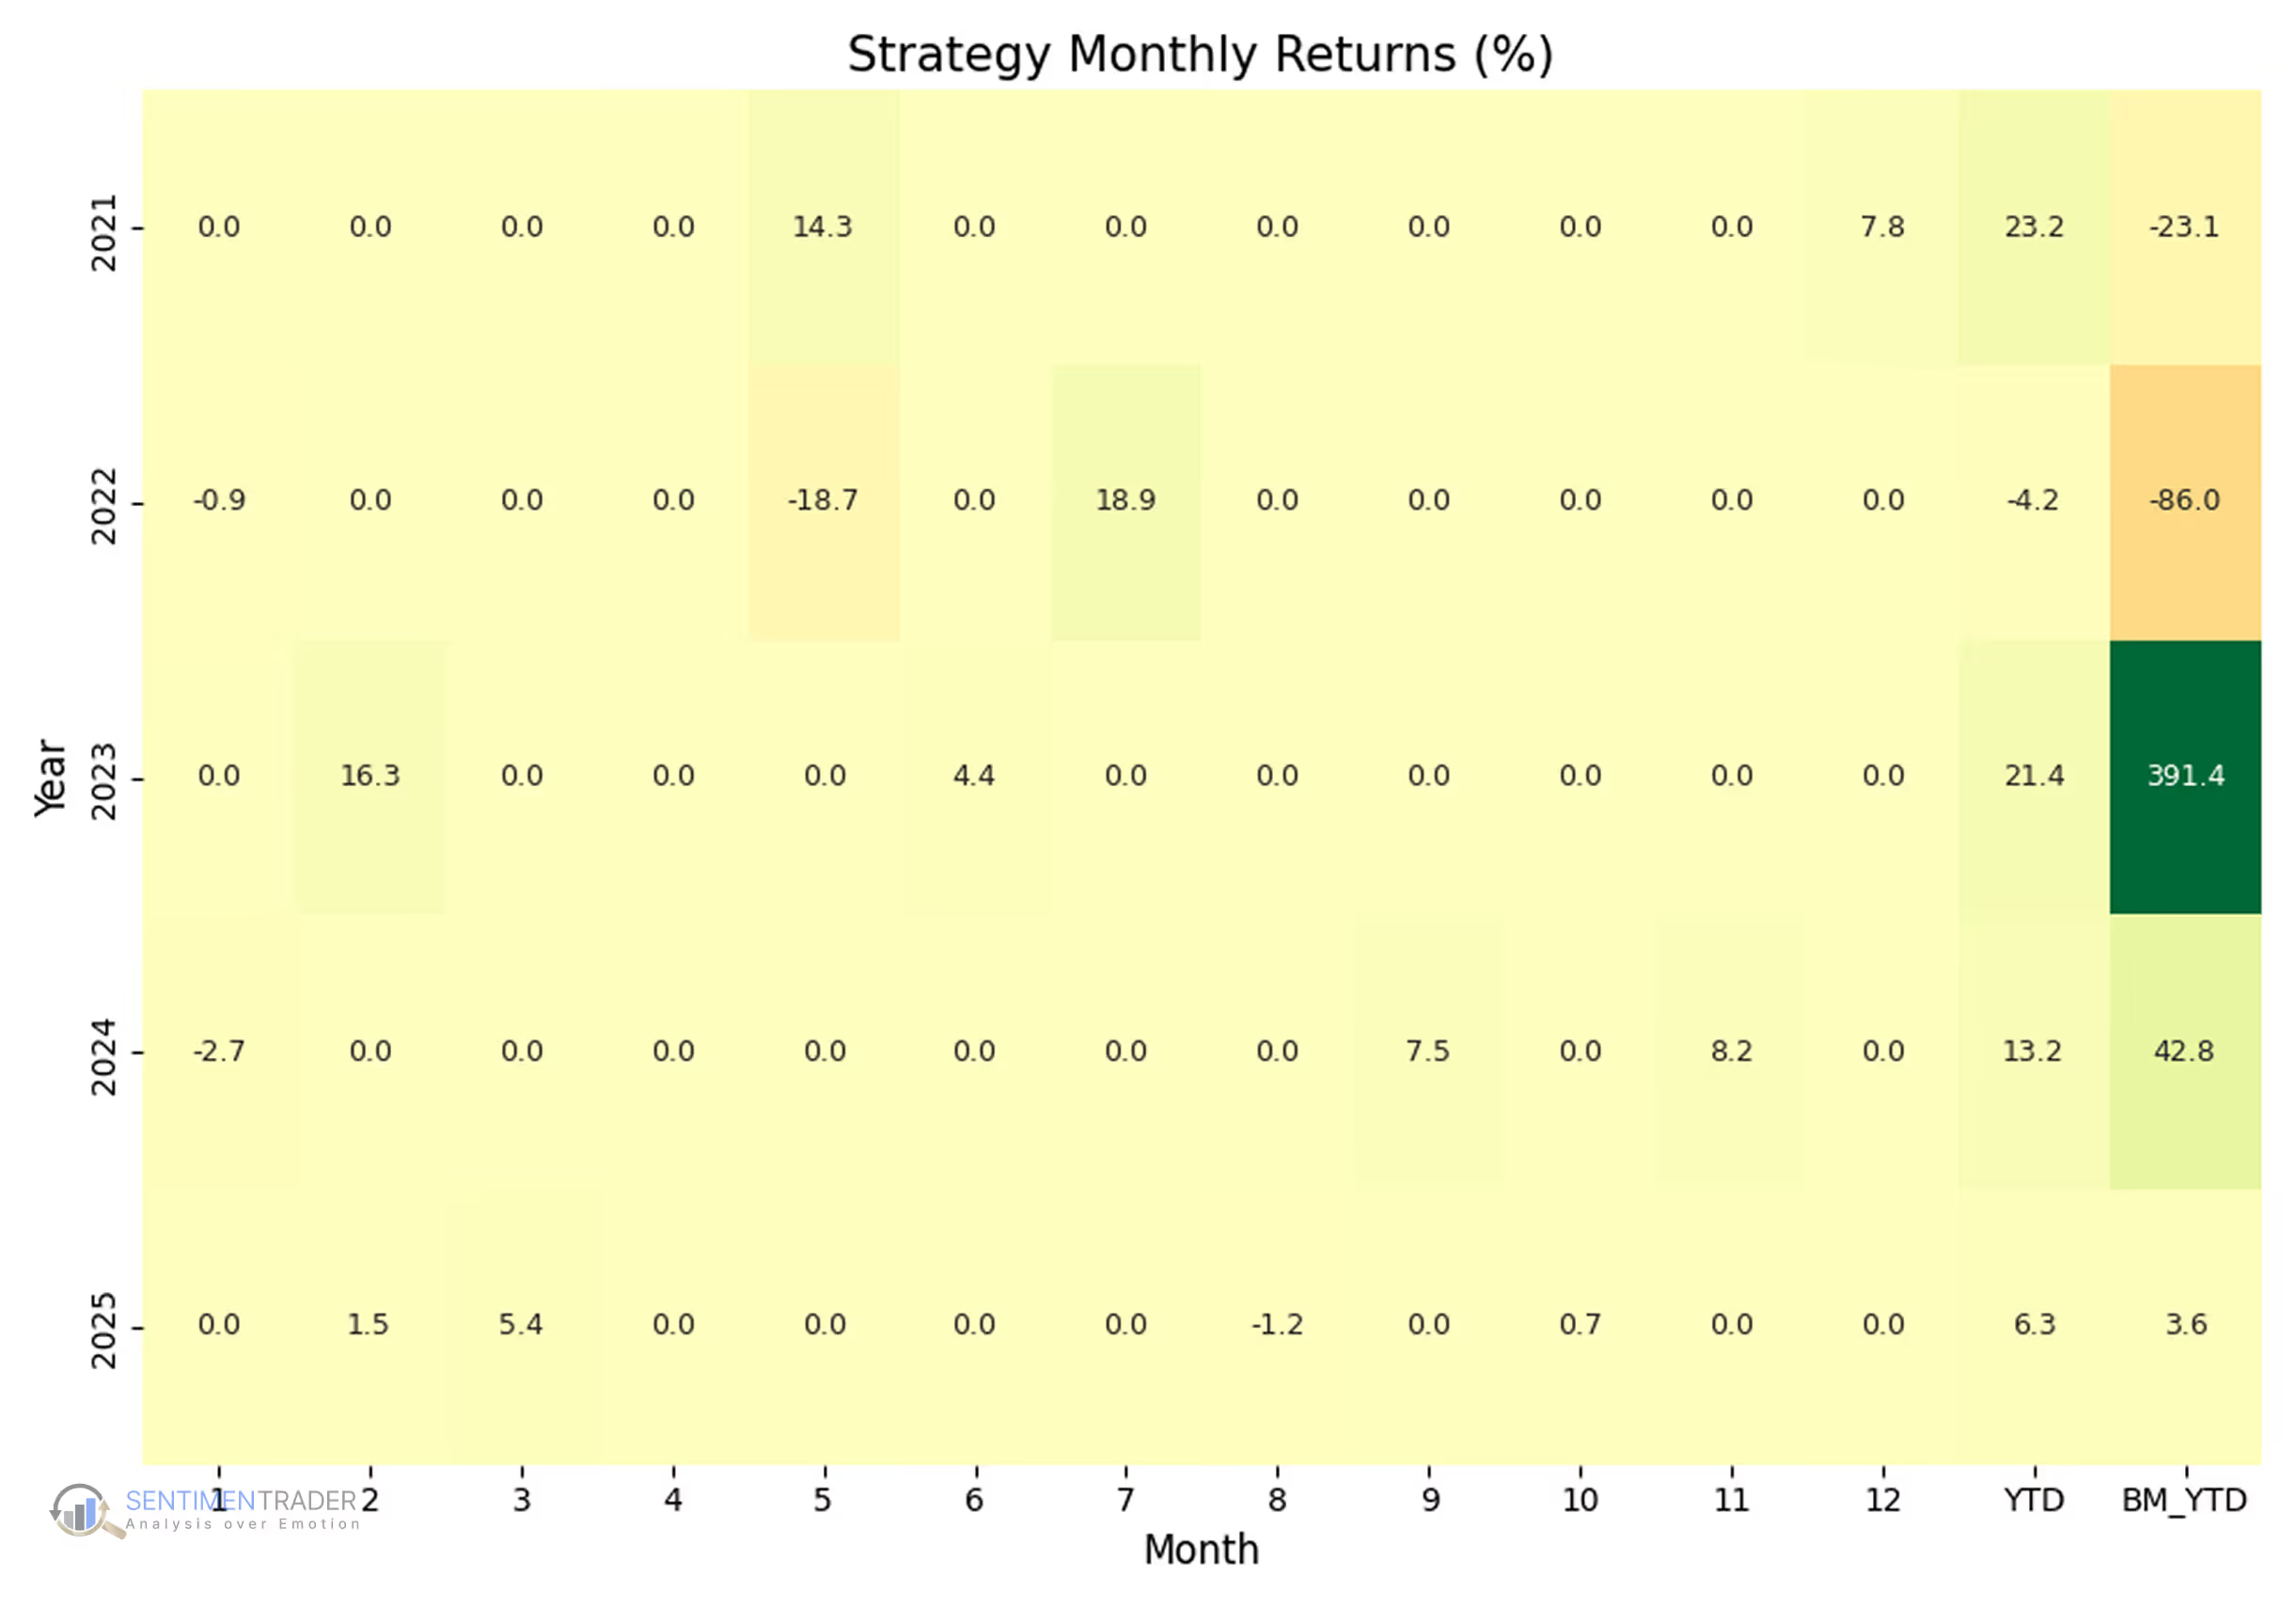
+72.5% total return (vs. –21.6% for buy-and-hold).
Reduced drawdowns: maximum risk of –36.3%, far smaller than the benchmark’s deep and prolonged declines.
Selective participation: only 15 trades over the full period.
High win rate: 73.3%, reflecting successful rebound capture.
Low exposure: in the market just 5.4% of the time, avoiding extended drawdowns.
Takeaway: Even though STARC Bands do not capture sustained trends or frequent short-term gains, they have historically helped traders frame risk and exploit volatility extremes, delivering positive returns with minimal market exposure and significantly reduced drawdowns.
This backtest was run using SentimenTrader’s Proprietary Backtest Engine, which lets you test your strategy with nearly 100 technical indicators and over 17,000 proprietary sentiment indicators—no coding required.
The Technical Bit
Calculation:
Common default settings:
SMA period: 6
ATR period: 6
Multiplier: 2
Quick note on SMA: A Simple Moving Average takes the average of past closing prices over a set number of periods, smoothing out short-term noise.
Quick note on ATR: The Average True Range measures market volatility by calculating the average range between daily highs and lows (including gaps). It expands when volatility rises and contracts when markets calm down.
Together, these elements make STARC Bands responsive to both trend and volatility.
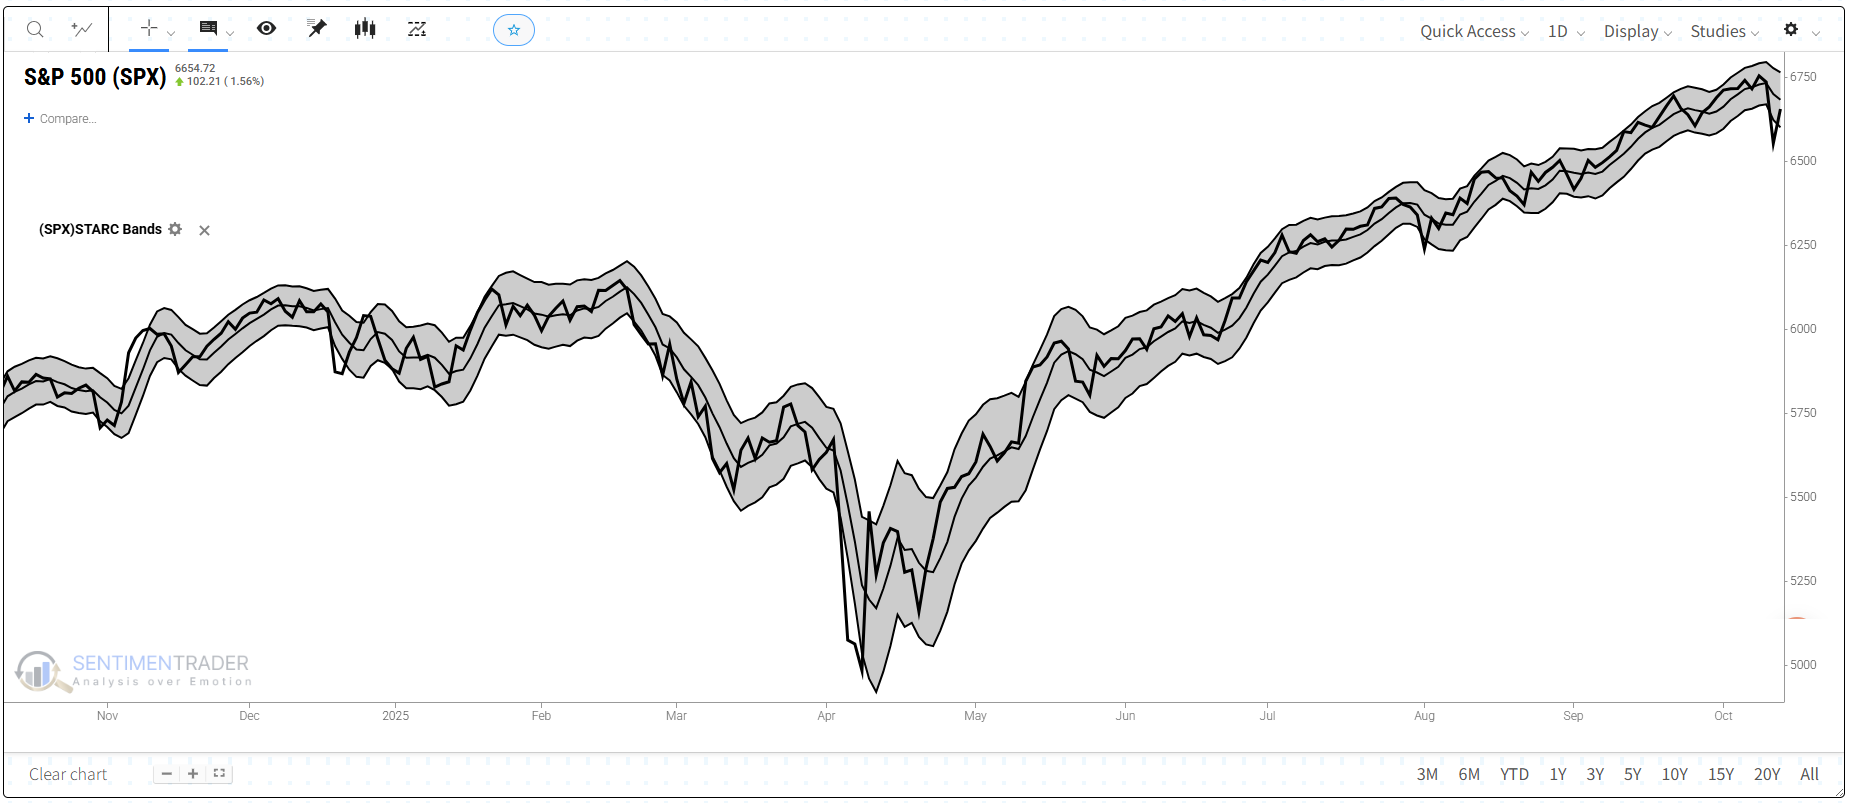
Upper Band: Marks areas where price may be overextended relative to recent volatility.
Lower Band: Highlights potential oversold or lower-risk buy zones.
Middle SMA Line: Acts as a short-term trend guide.
What This Means for Traders
STARC Bands give traders a framework for assessing relative risk. By blending volatility with trend, they help identify when markets are unusually stretched — a potential setup for disciplined entries or exits.
However, because STARC Bands are reactive, they can lag or give premature signals in strong trending markets. That’s why traders often combine them with other categories of tools — for example, Moving Averages (Trend) for direction, MACD (Momentum) for confirmation, or On-Balance Volume (Volume) to check if participation supports the move.
Using these tools together can help traders focus on higher-probability, lower-risk setups while filtering out noise.


.avif)